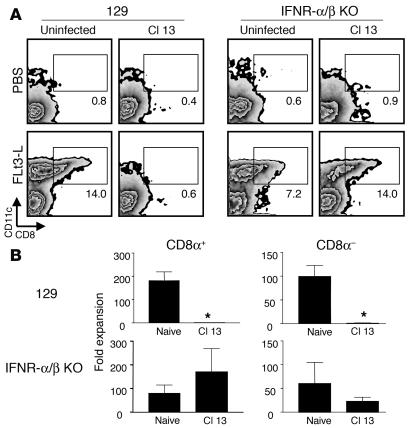
Figure 5.
IFN-α/βR0/0 mice infected with Cl 13 expand DCs in response to Flt3-L treatment. Splenic DCs were isolated from uninfected or Cl 13–infected IFN-α/βR0/0 and 129/SvEv mice treated for 10 days with Flt3-L (see Figure 3). The Flt3-L treatment was initiated at day 15 after infection. (A) Dot plots show CD11c+CD8α+ and CD11c+CD8α– DCs in mice treated with PBS or Flt3-L. Boxes denote the percentage of CD11c+CD8α+ DCs. Note the normal expansion of CD11c+CD8α+ DCs in Flt3-L–treated IFN-α/βR0/0 mice infected with Cl 13. (B) The fold expansion of both CD11c+CD8α+ and CD11c+CD8α– DCs is plotted for naive and Cl 13–infected mice. The fold expansion was calculated by dividing the absolute number of each DC subset in Flt3-L–treated mice by the absolute number of cells in PBS-treated mice. Data are presented as the mean ± SD. Statistical differences denoted by asterisks were determined using a Student t test (P < 0.05).

