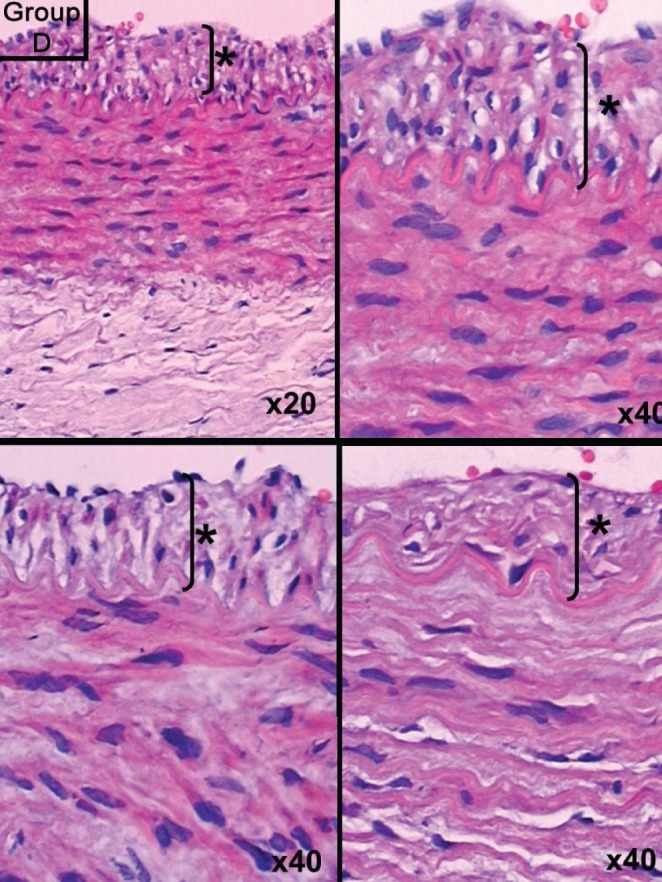
Figure 4).

Group D slide showing intimal hyperplasia. Hematoxylin and eosin stain, original magnification indicated in lower right of each panel. Asterisk (*) and bracket indicate thickness of intimal hyperplasia

Group D slide showing intimal hyperplasia. Hematoxylin and eosin stain, original magnification indicated in lower right of each panel. Asterisk (*) and bracket indicate thickness of intimal hyperplasia