
Figure 3).
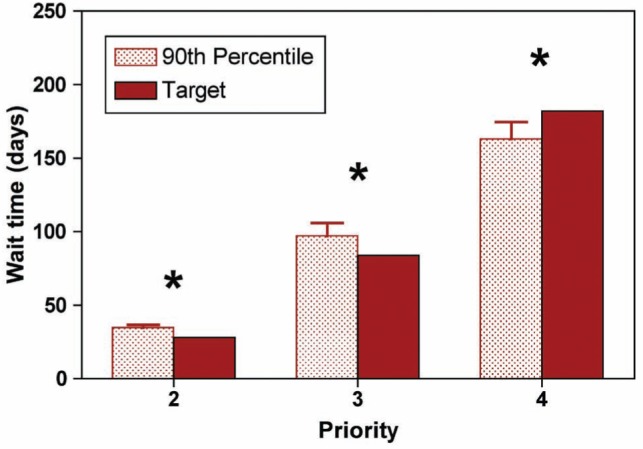
Comparison of 90th percentile wait times (shaded) with provincial benchmarks (solid) according to procedure priority. Error bars represent SD. *Statistically significant (ie, P<0.05)
Official websites use .gov
A
.gov website belongs to an official
government organization in the United States.
Secure .gov websites use HTTPS
A lock (
) or https:// means you've safely
connected to the .gov website. Share sensitive
information only on official, secure websites.
Comparison of 90th percentile wait times (shaded) with provincial benchmarks (solid) according to procedure priority. Error bars represent SD. *Statistically significant (ie, P<0.05)