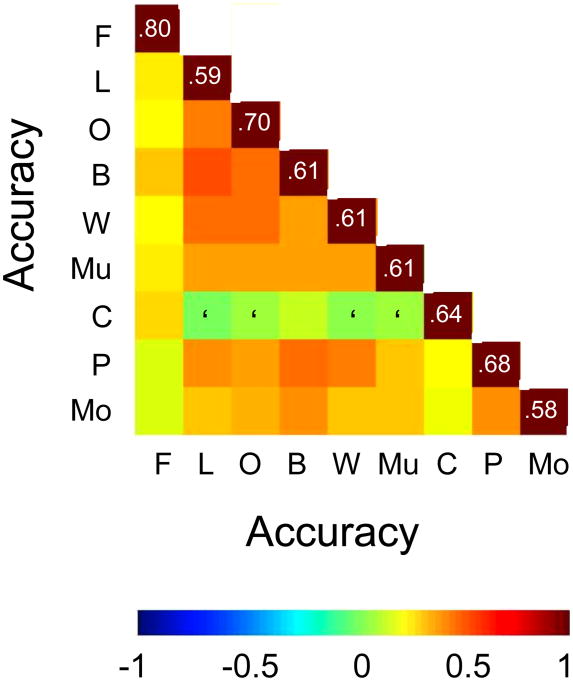
Figure 3.
Heatmap depicting partial correlations for Accuracy rates across categories (faces (F), leaves (L), owls (O), butterflies (B), wading birds (W), mushrooms (Mu), cars (C), planes (P) and motorcycles (Mo)), while partialing out the influence of age and sex variables. All correlations are significant (p<0.05) except those indicated with an apostrophe (‘). The values in the downward diagonal of maroon squares represent the average group accuracy for a particular category.

