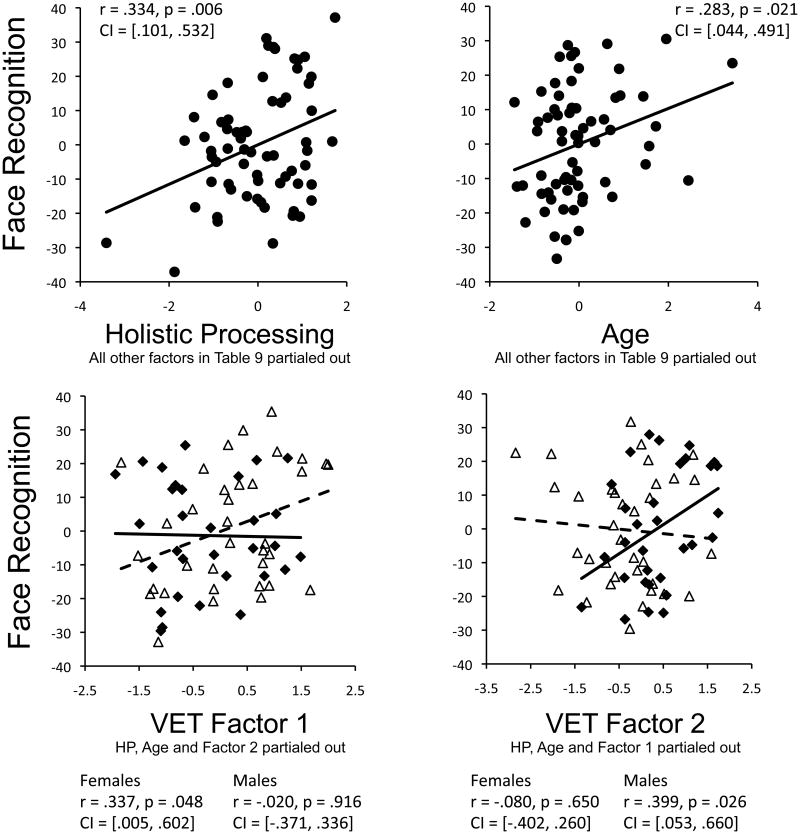
Figure 5.
Partial correlations and 95% confidence intervals between face recognition (accuracy on CFMT noise trials) and holistic face processing (congruency × alignment interaction in d′), age, and object recognition (VET Factor 1, VET Factor 2). In the bottom two plots, triangles and dashed lines show datapoints and the trendline for female participants, and diamonds and solid lines show datapoints and the trendline for male participants.

