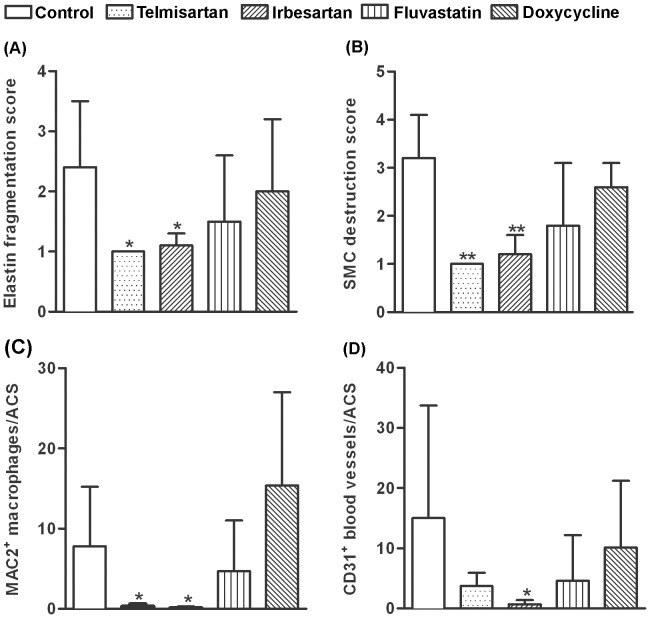
Figure 3. Quantitative aortic histology.
Medial elastin fragmentation and SMC loss were assessed on a 1–4 scale. A, B: Destruction scores for medial elastin (A) and SMCs (B). C, D: Mural macrophages (C) and CD31+ neovessels (D) per aortic cross section (ACS). Data in A–D reported were mean±standard deviation, 4–5 mice per group. Nonparametric Mann-Whitney test, *P<0.05 and **P<0.01 compared to control group.

