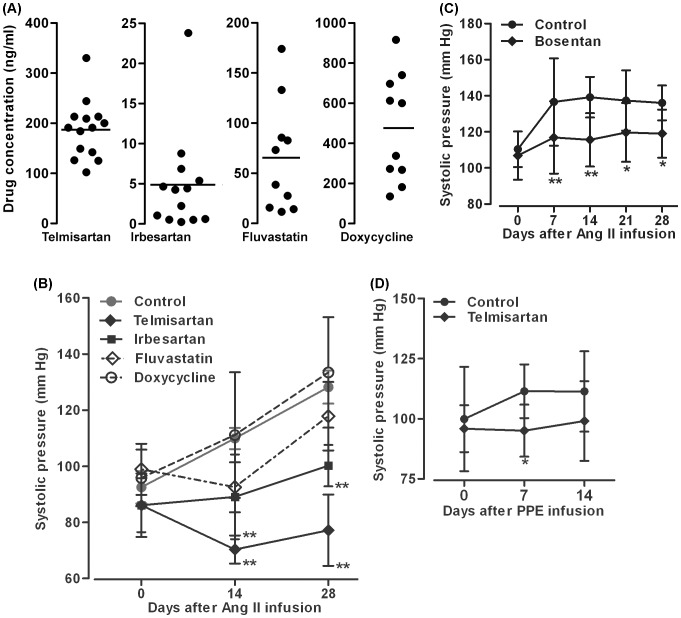
Figure 5. Effect of drug treatment on systolic blood pressure.
A: Dot plot graphs show plasma drug levels in individual Ang II-infused ApoE−/− mice receiving each drug treatment. Horizontal line in each graph indicates mean drug concentration from 10–14 mice in each group. B: Effect of telmisartan, irbesartan, doxycycline and fluvastatin on systolic blood pressure in ApoE−/− mice 14 and 28 days after Ang II infusion. C: Effect of bosentan on systolic blood pressure in ApoE−/− mice 7, 14, 21 and 28 days after Ang II infusion. D: Effect of telmisartan on systolic blood pressure in C57BL/6J mice 7 and 14 days after PPE infusion. Data in B–D are given as mean ± standard derivation for each group. Data in B and C were obtained from separate experiments, each with its own control group. In all experiments, two-way ANOVA followed by Newman-Keuls post-test, *P<0.05 or **P<0.01 compared to control group at same time points. n = 10–15 (A–C) or 7–9 (D) mice in each group.

