
Figure 1. Mean blood glucose concentrations (mg/dl) (a), daily insulin dose (international unit [IU]) (b), systolic and diastolic blood pressure (mmHg) (c) at baseline and during the first 10 days of IT.
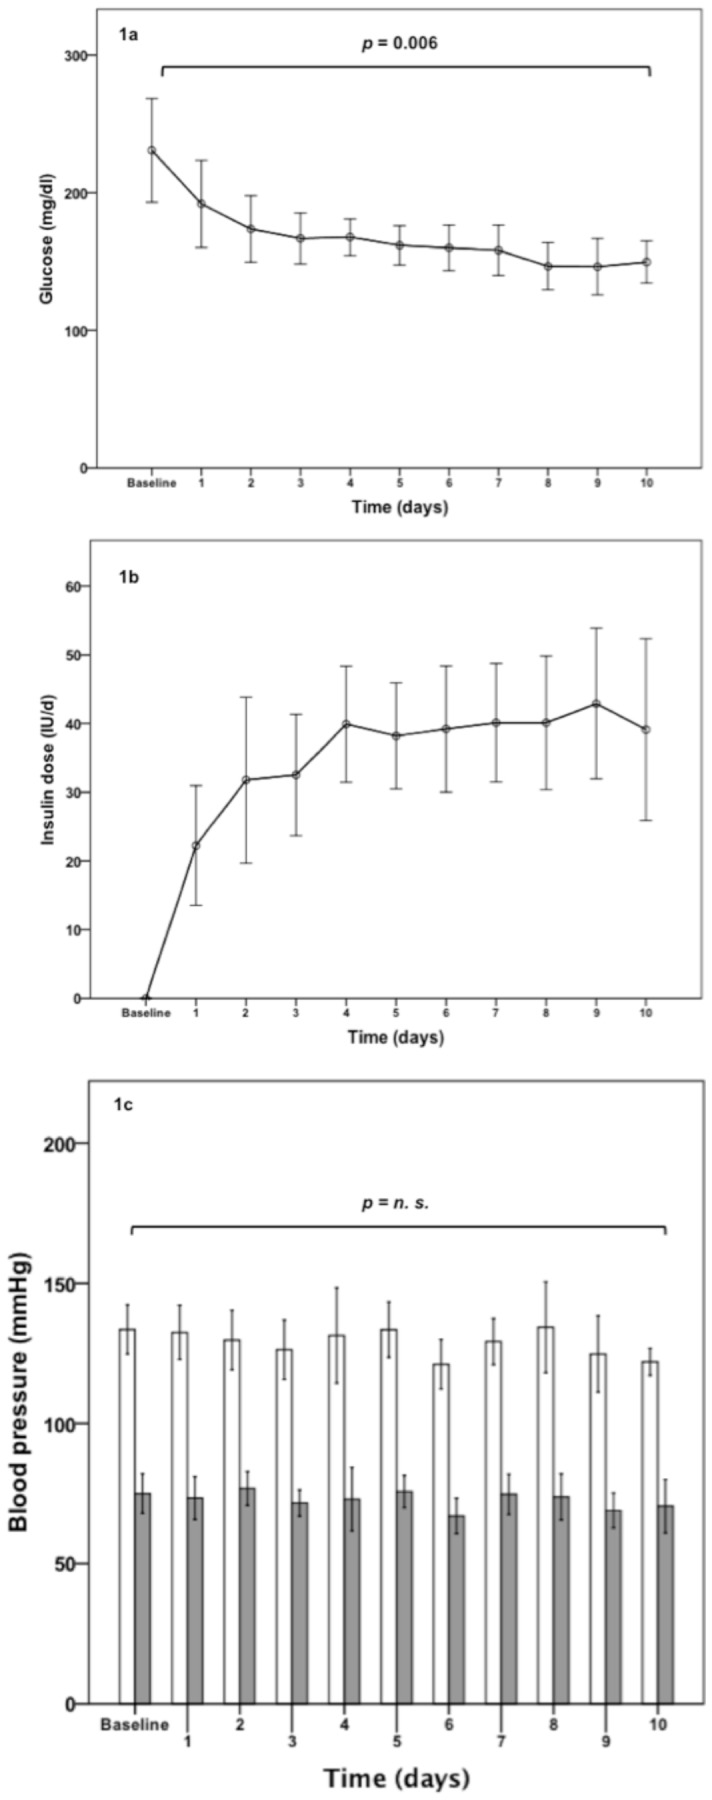
Empty bars indicate systolic and gray bars diastolic blood pressure values; error bars delineate SEM.