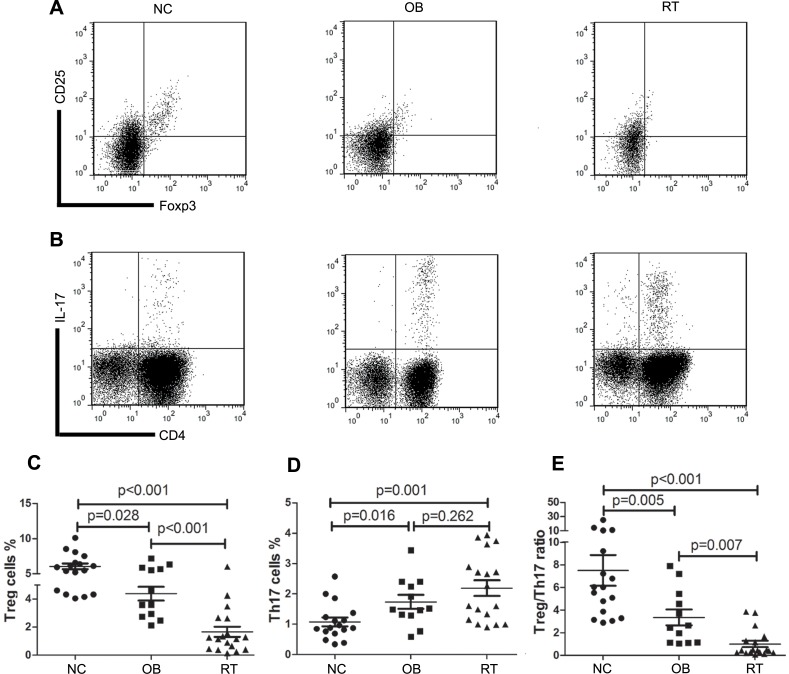
Figure 1. Treg/Th17 balance of ITP patients skewed toward Th17.
A. Representative dot plots of Treg cells (CD4+CD25hiFoxp3+ cells) in NC, OB and RT group. B. Representative dot plots of Th17 cells (CD3+CD4+IL-17+ cells) in NC, OB and RT group. C. The mean ± SD of the percentage of Treg cells in different group. D. The mean ± SD of the percentage of Th17 cells in different group. E. The mean ± SD of the Treg/Th17 ratio in different group. p value was shown in the figure. NC: normal control; OB: observation ITP patients; RT: ITP patients requiring treatment.

