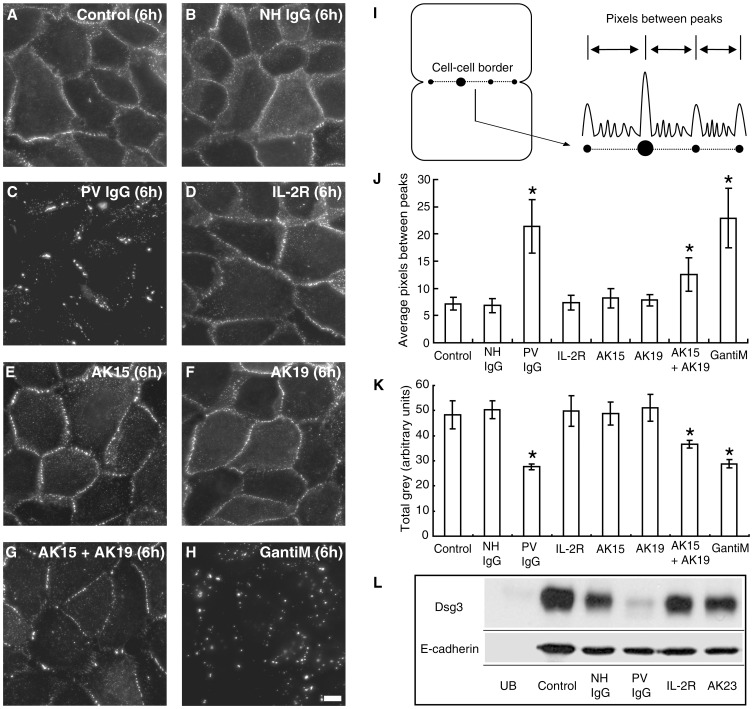
Figure 2. PV IgG causes clustering and loss of surface Dsg3.
(A–H) Cell surface Dsg3 was pulse-labeled with biotinylated AK23 and detected using streptavidin-conjugated Alexa Fluor 555. AK23-bound Dsg3 (AK23-Dsg3) was found primarily at cell-cell junctions on the cell surface after 6 h with either no antibody (control) (A) or with NH IgG (B). Addition of PV IgG caused a redistribution of surface AK23-Dsg3 into highly concentrated regions of staining along cell borders (C). Addition of an irrelevant monoclonal antibody against the IL2-receptor caused no change in AK23-Dsg3 distribution (D). When AK15 or AK19 were added, AK23-Dsg3 border staining remained similar to controls (E,F). However, addition of both AK15 and AK19 together resulted in a highly punctate pattern of AK23-Dsg3 at borders (G). Similarly, addition of goat anti-mouse IgG clustered AK23-Dsg3 (H). (I) Procedure for measuring distance between peak fluorescent intensities. (J) Quantitative assessment revealed that the distance between AK23-Dsg3 peak fluorescence intensity increased in cells treated with PV IgG, the AK15/19 combination, or goat anti-mouse IgG. (K) Total surface fluorescence intensity measurements (Total grey) demonstrated that PV IgG, the AK15/19 mixture, as well as goat anti-mouse IgG reduced Dsg3 cell surface levels. (L) In cell surface biotinylation analysis, PV IgG reduced Dsg3 surface levels, while cell surface Dsg3 remained relatively stable even after 24 h in cells treated with NH IgG or pathogenic doses of AK23. UB indicates unbiotinylated sample. Control reflects total surface levels at 0 hr. *Indicates statistical significance compared to control (P<0.05). Scale bar in A-H, 10 µm.

