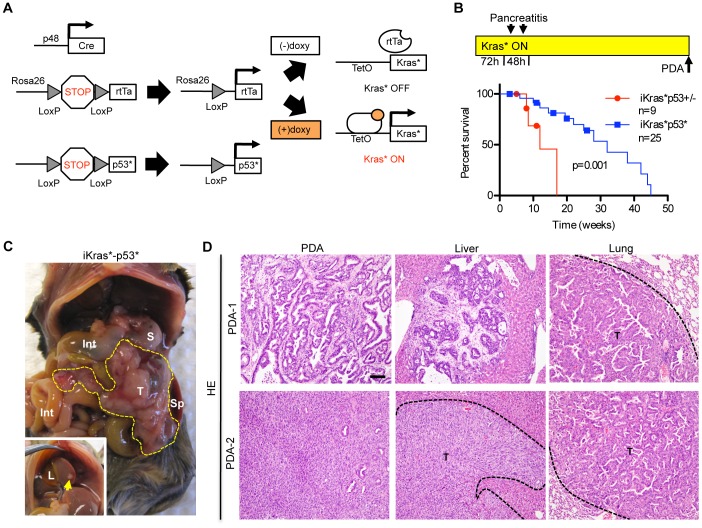
Figure 1. The iKras*p53* model of metastatic pancreatic adenocarcinoma.
(A) Genetic makeup of iKras*p53* mice. (B) Experimental design: doxy was administered continuously, starting at weaning. Acute pancreatitis was induced within 72 hrs, then the animals were aged until they developed tumors. Kaplan-Meier survival curve. iKras*p53*, n = 25; iKras*p53+/−, n = 9. Log-rank statistical analysis yielded a P value of 0.001. (C) Gross morphology pictures of a primary tumor and liver metastases. T: tumor, S: stomach, Sp: spleen, Int: intestine, L: liver (D). Histology of a moderately differentiated (top row) and an un-differentiated (bottom row) pancreatic tumor; liver and lung metastases. T: tumor. Scale bar 100 um.

