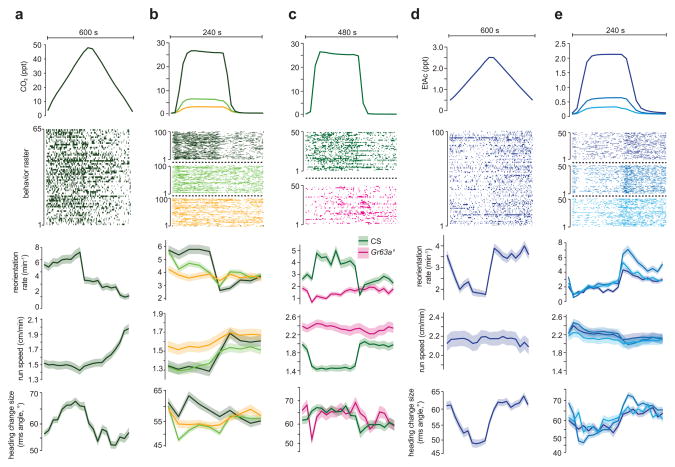
Figure 5. Temporal CO2 and EtAc gradients.
Statistics of turning decisions of larvae subjected to spatially uniform temporal gradients of CO2 delivered as repeating cycles of triangle waves (a) and steps (b,c) and of EtAc delivered as triangle waves (d) and steps (e). Upper panel in each plot shows one cycle of stimulus waveform. Raster plots indicate periods in which an individual larva was turning during the cycle, each row represents one larva tracked continuously through a cycle (a, n = 65, b n = 100 ea condition, c n = 50 ea condition, d,e n = 100 each condition) Lower panels show the turning rate and s.e. derived from counting statistics, mean crawling speeds and s.e.m. calculated as described in methods, and mean square heading change after turns and one s.e. vs. the time within each cycle. Data from wild-type larvae (Canton-S) are shown in (a,b,d and e). The step response of wild-type larvae and GR63a1 mutant larvae are compared in (c).

