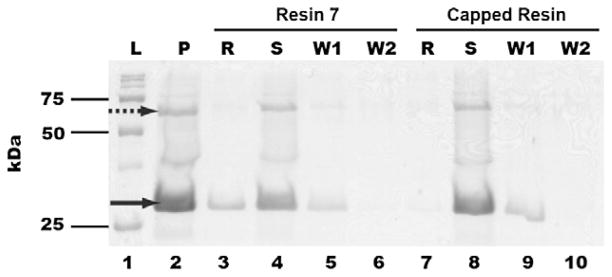
Figure 2.

SDS–PAGE analysis of purified QscR with resin 7. L: protein molecular weight ladders; P: purified QscR; R: protein denatured from resin 7 after incubation; S: flow-through solution from resin 7-QscR incubation; W1: 1st washing solution; W2: 2nd washing solution. Data for both resin 7 (lanes 3–6) and ethanolamine-capped control resin (lanes 7–10) are provided. The solid arrow indicates the presence of QscR; the dashed arrow was a GroEL contaminant.45
