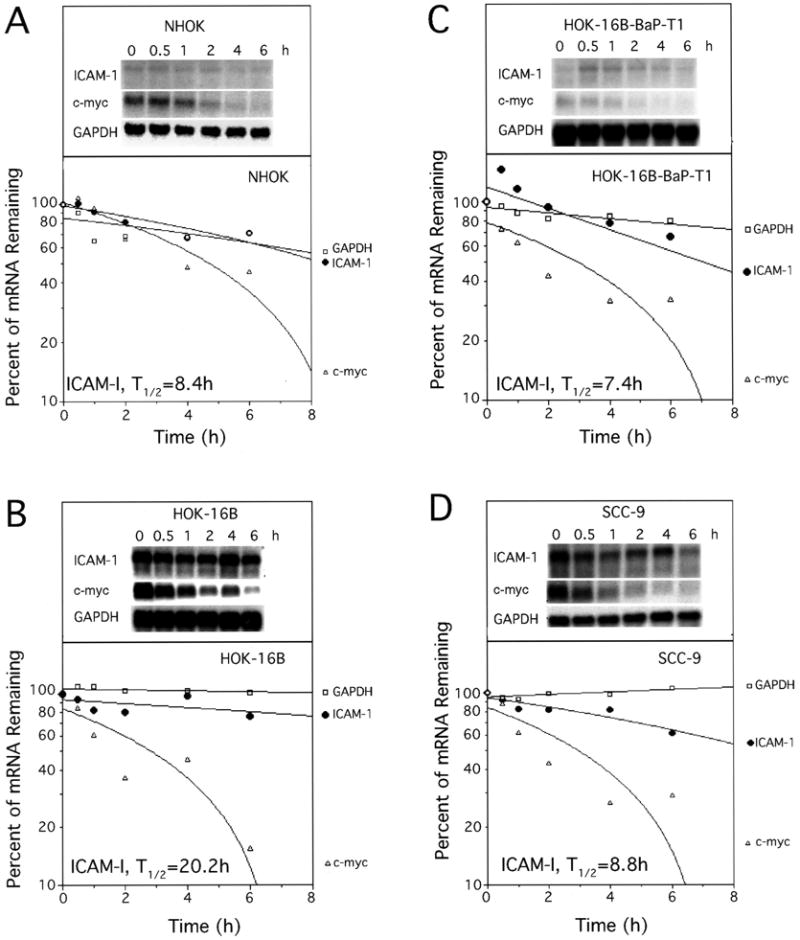
Fig. 4.

ICAM-1 mRNA half-lives in oral epithelial cells. At different time points (0, 0.5, 1, 2, 4 and 6 h) following ActD treatment, RNA were isolated and subjected to Northern blot analysis. Northern blot images and plots to determine the message half-lives are shown. The signal densities of ICAM-1 mRNA were measured by NIH imaging software. T1/2, mRNA half-life.
