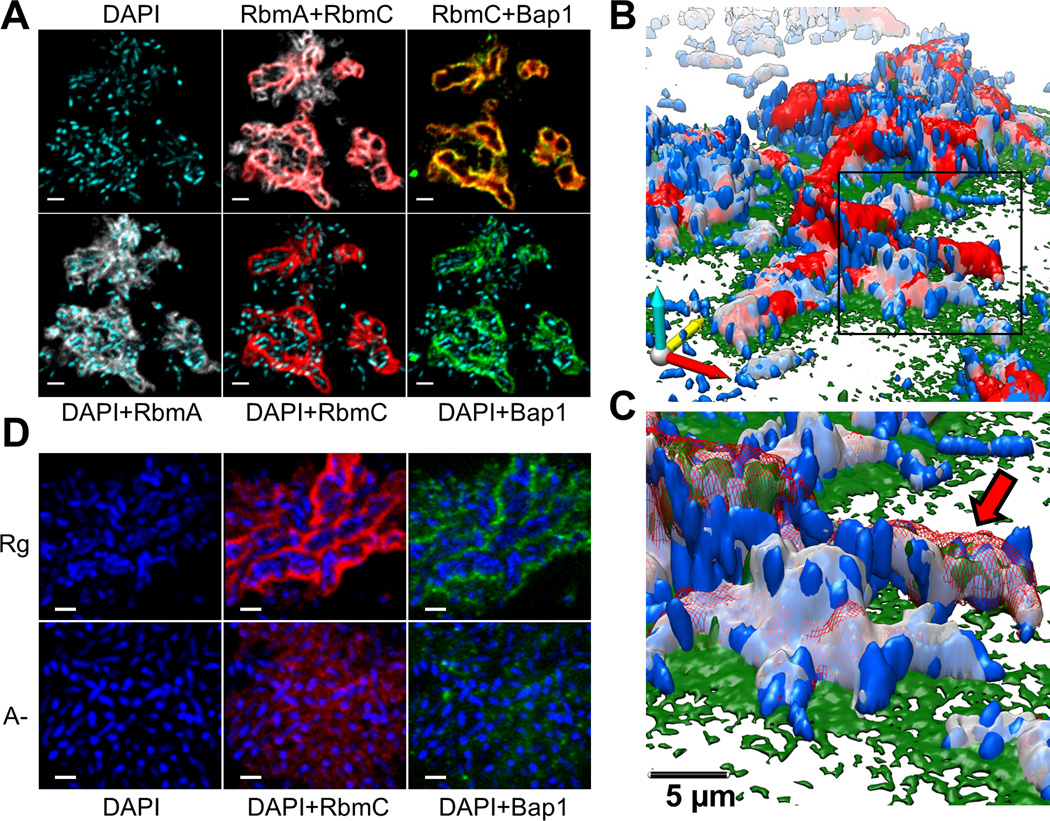
Fig. 1. V. cholerae biofilm structure.
(A) Optical section of biofilm 4 µm above coverslip. Images are pseudo-colored blue (cells), gray (RbmA), red (RbmC) and green (Bap1). RbmA localizes around and within cell clusters. RbmC and Bap1 encase cell clusters. Cells were counterstained with DAPI. Scale bars, 3 µm. (B) 3D biofilm architecture. Colors as in (B). (C) Enlargement of the boxed region in (B). Red arrow indicates one cell cluster. Red signal now rendered partially transparent to allow visualization of cells within an RbmC-containing cluster. (D) Comparison of biofilm architecture formed by rugose (Rg) and ΔrbmA (A-) strains. RbmA is required for cell cluster formation. Scale bars, 2 µm.

