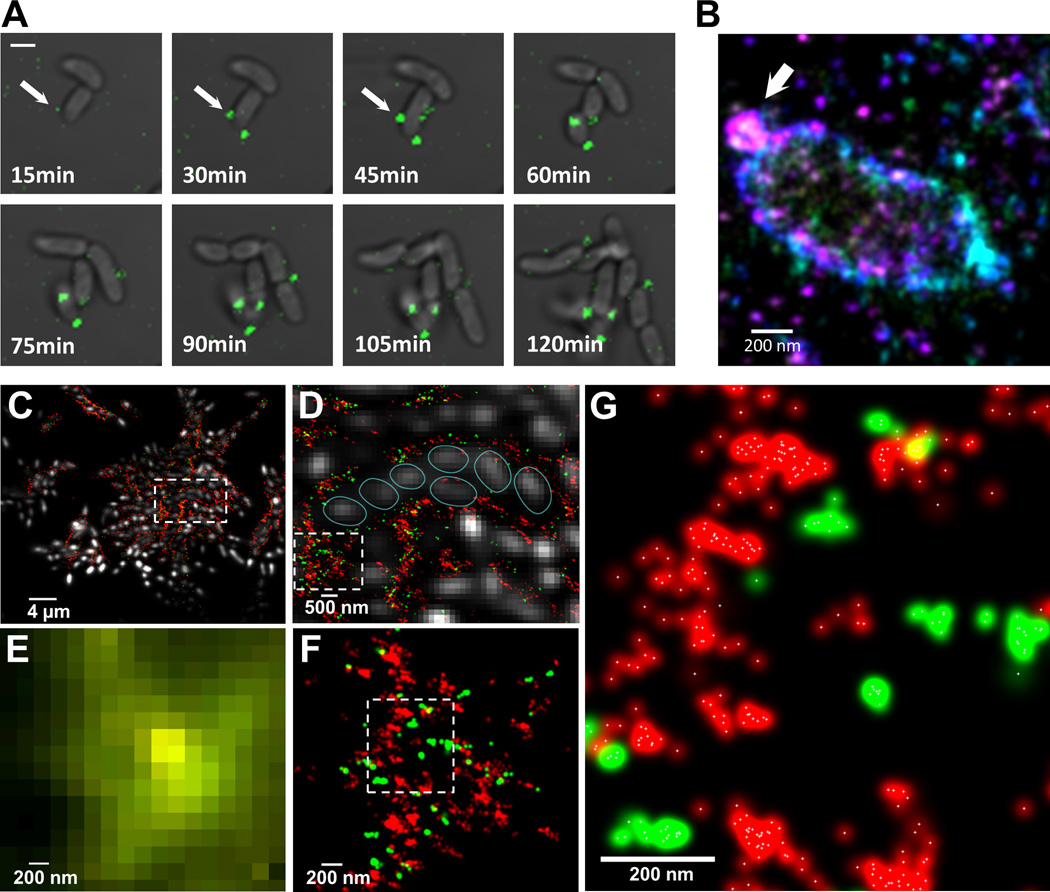
Fig. 3. Exopolysaccharide secretion, initial organization and molecular architecture of V. cholerae biofilms.
(A) Time-lapse CLSM images of VPS (green) production/secretion in V. cholerae cell during biofilm formation. Fluorescent images of VPS are merged with bright-field images of cells. Scale bars, 2 µm. (B) 3D superresolution image of a single V. cholerae cell. White arrow indicates a ball-like structure of VPS on the surface of V. cholerae cell early in biofilm formation. Color corresponds to height (−300 nm (violet) to +300nm (red)). (C) 3D two-color superresolution image (200 nm z-section) of a rugose variant biofilm showing molecular organization of VPS (red) and RbmC (green) around cell clusters. Cells were counterstained with DAPI (white). (D) Enlarged boxed region in (C) showing organization of cells within VPS/RbmC-enclosed cluster. Individual cells were outlined (cyan) for clarity. (E) Enlarged boxed region in (D) as it appears in conventional, diffraction-limited microcopy, showing unresolved VPS and RbmC signals. (F) Superresolution image of the same region in (E), showing distribution of RbmC and the VPS polymers in a biofilm matrix. (G) Enlarged boxed region in (F). White crosses indicate the center of a Gaussian-fit to each localization events.

