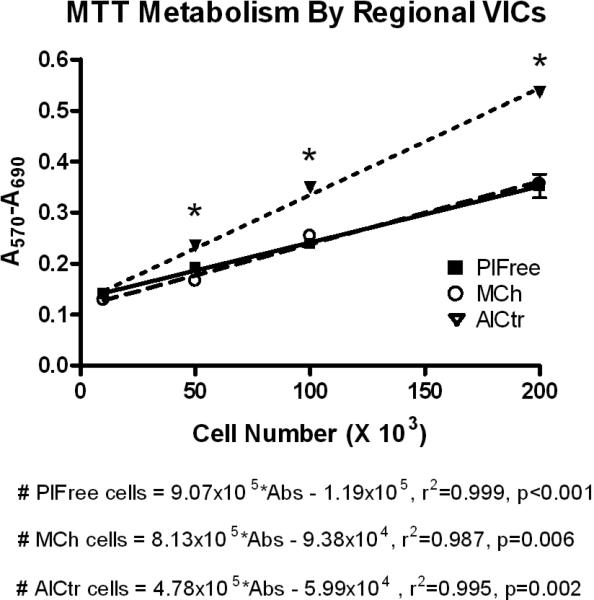
Figure 2.

Metabolism by regional VICs. AlCtr = anterior leaflet center, MCh = mitral chordae, PlFree = posterior leaflet free edge. Data points and error bars represent mean and standard deviation of triplicate MTT absorbance measurements. *p<0.001, AlCtr vs. other cell types.
