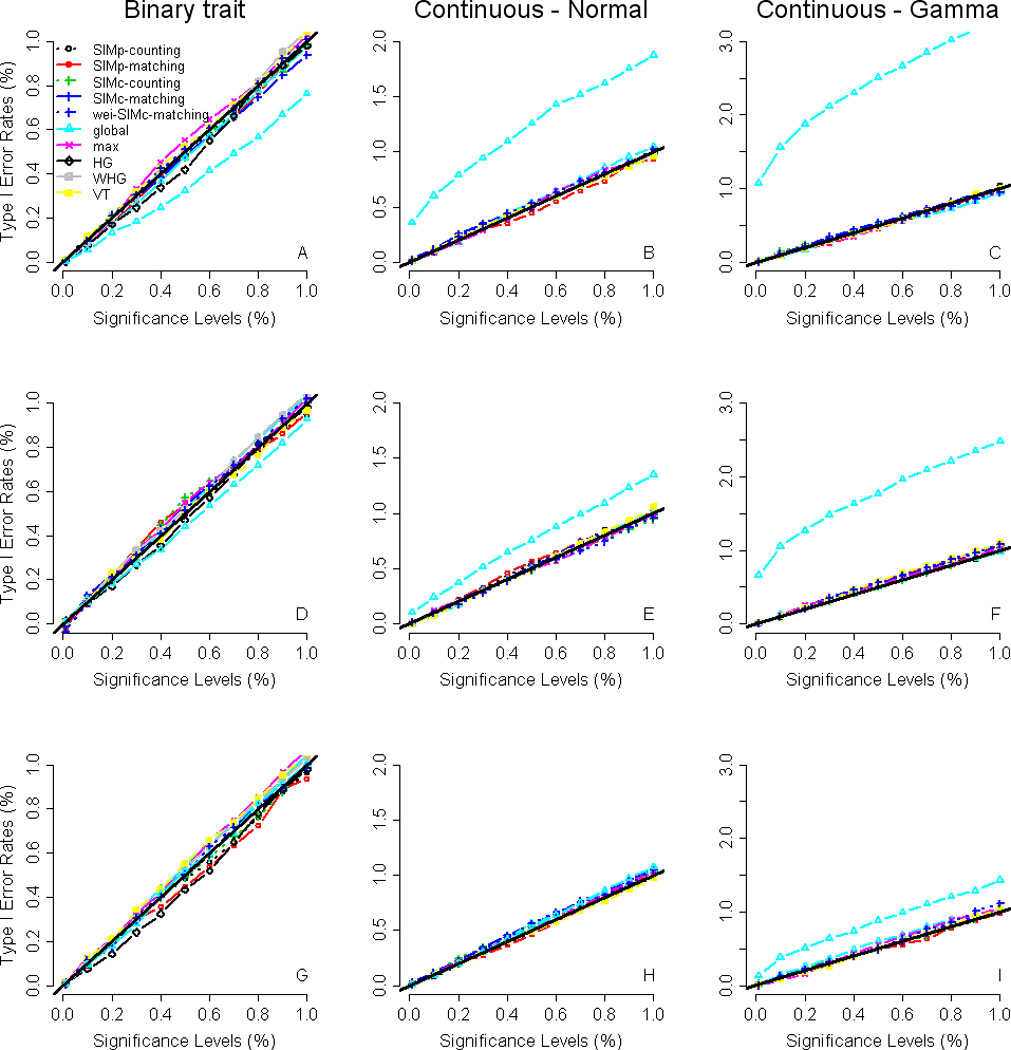
Figure 1. Type-I error rates.

The x-axis is the nominal significance level (where the left-most point is 10−4 and the right-most point is 10−2), and the y-axis is the type-I error rate. The different panels in the figure are arranged such that the cutoff value of haplotype frequencies is 0.125%, 0.25%, and 1% (from top to bottom) and the trait is binary, continuous with a normally distributed error term, and continuous with a Gamma-distributed error term (from left to right). In each panel, there are two curves for the global test (one is based on asymptotic P values whereas the other is based on permutation P values). For panels G and H, both the two curves for the global test are on the line y = x (the black bold line). For other panels, the one on the line y = x is for the global test based on permutation P values and the one off the line y = x is for the global test with asymptotic P values. Note that the ranges of the y-axis for the three trait distributions are different in order to present the curve of the global test based on asymptotic P values.
