
Figure 3. Comparison of power by r (the percent of variants among the d causal variants that increase the trait value), the marginal heritability, and d (the number of causal variants), given a continuous trait.
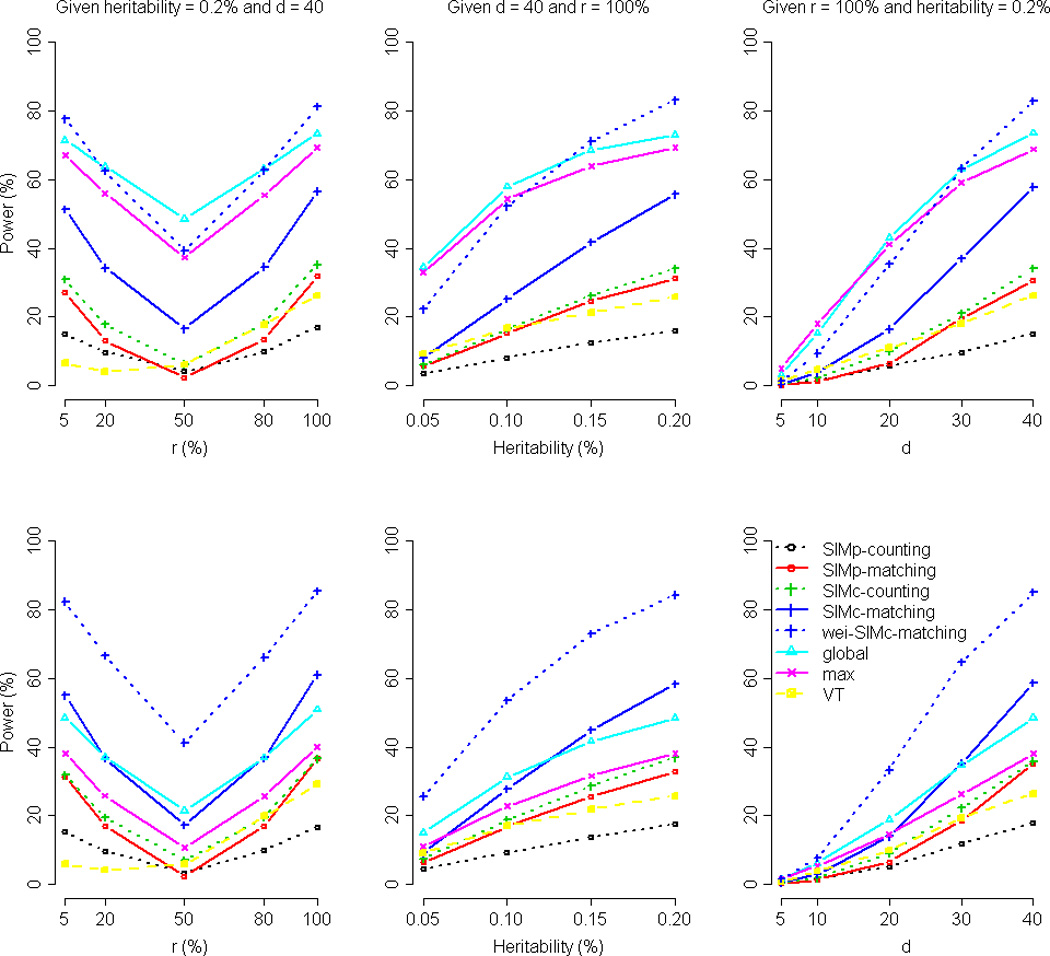
The figure shows the power comparison by r (the left column, given the marginal heritability = 0.2% and d = 40), the marginal heritability (the middle column, given d = 40 and r = 100%), and d (the right column, given r = 100% and the marginal heritability = 0.2%), respectively. The nominal significance level was set at 10−3. The trait is continuous with a normally distributed error term (top row) and continuous with a Gamma-distributed error term (bottom row), respectively. The result given the nominal significance level of 10−4 is shown by Supplementary Figure S7.