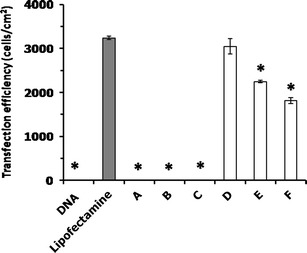
Fig. 5.

Comparison of the in vitro transfection efficiencies of liposomes/DNA complexes formulated from PC and cationic lipids a, b, c, d, e, and f at a weight ratio of 25 in HeLa cells. Each value represents the mean ± standard deviation of three wells. *Statistically significant (p < 0.05)
