
Table II.
The Methodology Parameters and the Calibration Plots of the Reference Method (n = 6)
| Compounds | t R (min) | Regression equation | R 2 | Linearity range (μg/mL) | LOD (μg/mL) | Repeatability RSD% | Recovery % |
|---|---|---|---|---|---|---|---|
| HG | 36.091 |
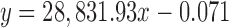
|
0.9999 | 2.55–30.60 | 0.05 | 1.13 | 99.39 |
| CA | 39.462 |
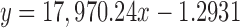
|
0.9999 | 3.44–41.25 | 0.09 | 1.21 | 99.75 |
| AT | 29.681 |
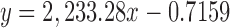
|
0.9999 | 6.78–81.45 | 0.16 | 0.92 | 99.75 |
| ARC | 32.196 |
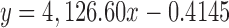
|
0.9998 | 3.55–42.60 | 0.07 | 1.00 | 99.85 |