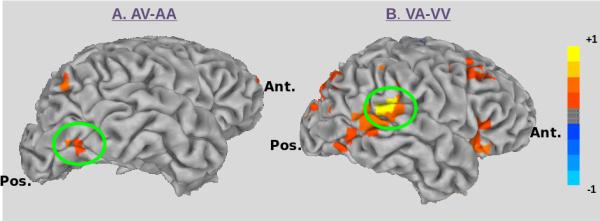
Figure 5. Source-Level Findings: Low Gamma Frequency.

A) The region in the visual ventral stream (right middle occipital gyrus) showing increased power in the low gamma frequency for the contrast AV-AA is highlighted by the green circle. B) The region in auditory association (right superior temporal gyrus) cortex showing increased power in the low gamma frequency for the contrast VA-VV is highlighted by the green circle.
