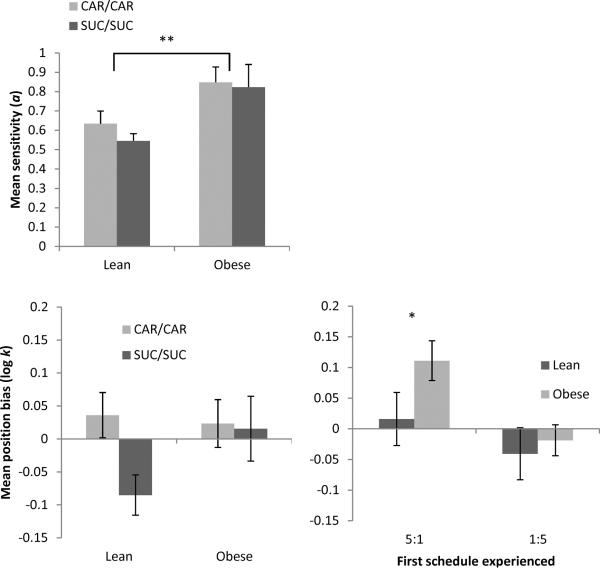
Figure 2.
Mean sensitivity (top) and bias (bottom) parameter values for lean and obese Zuckers in the CAR/CAR (gray) and SUC/SUC pellet (black) condition in Phase 1. Bottom right shows mean bias values as a function of which schedule with an uneven ratio was experienced first (5:1 or 1:5 ratio). Lean rats are shown in black; obese in gray. Error bars = 1 SEM.

