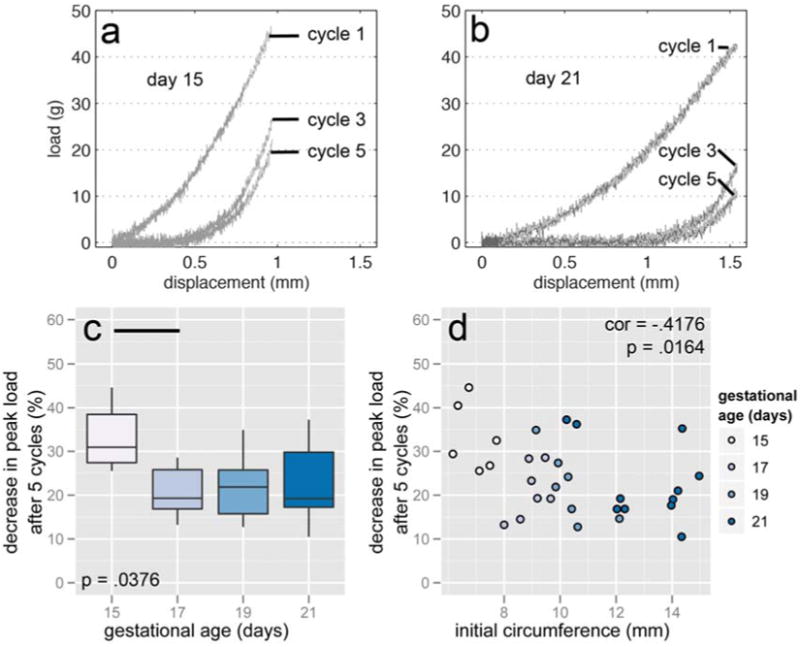
Figure 5.

Representative load-displacement curves from cycles 1, 3, and 5 from 15 day (a) and 21 day (b) cervices. The load at 25% strain decreased less in 15 day samples than in other gestational ages after 5 cycles (c) and negatively correlated with initial circumference (d). In addition to the pairwise difference illustrated in (c), the means comparison of day 15 with days 19 and 21 approached statistical significance (p = .0701 and .0826, respectively). A 50% decrease is equivalent to the load at cycle 5 being half what it was in cycle 1. Horizontal bars show pairwise statistical significance.
