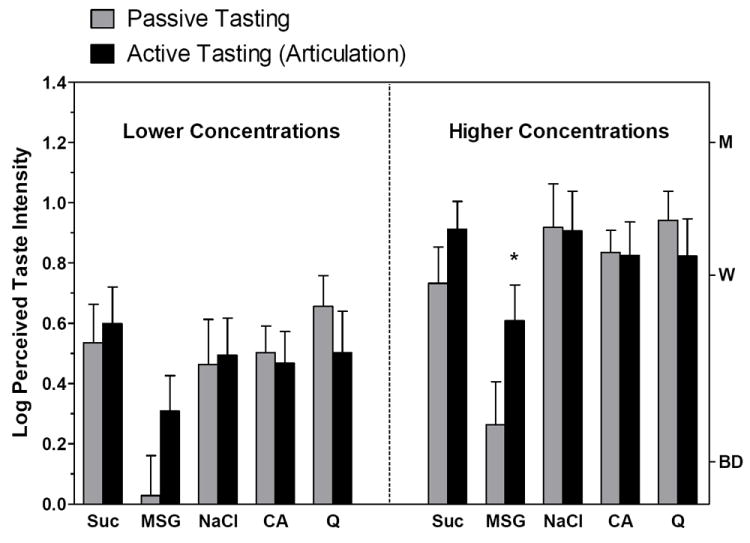
Fig. 2.

Log-mean intensity ratings for the dominant taste quality produced by 2 different concentrations of each of the 5 taste stimuli of Exp. 2 when the taste was passively received (gray bars) or actively perceived by articulating “taste-taste-taste” (black bars). Letters on the right Y-axis refer to intensity descriptors on the gLMS: BD = barely detectable; W = weak; M = moderate. Vertical bars = SEMs. (* denotes a significant difference)
