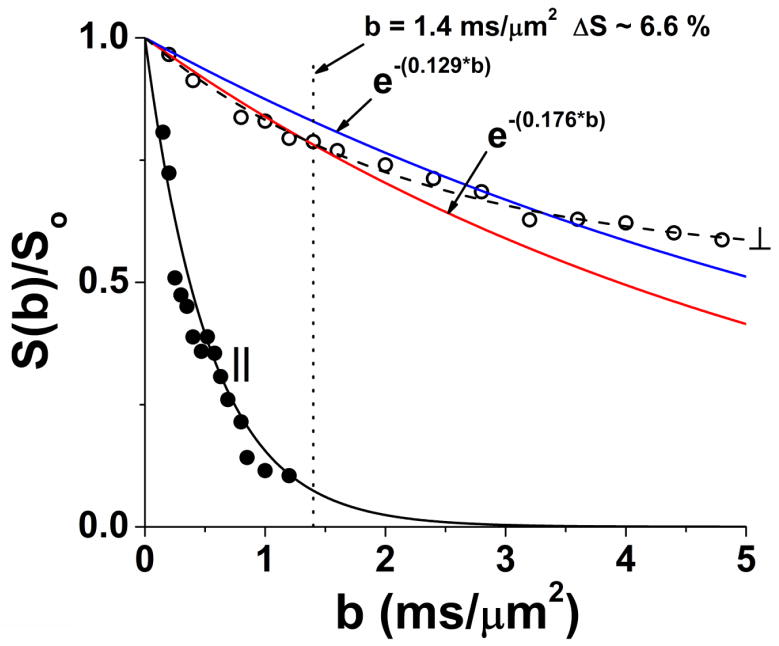
Figure 3.
Diffusion attenuation curves for a set of mouse optic nerves (n = 3) with diffusion weighting perpendicular and parallel to the nerve fibers (without visual stimulation), acquired with (δ = 5 ms, Δ = 18 ms). Parallel diffusivity is essentially mono-exponential. It is readily apparent that diffusion perpendicular to the fibers is highly restricted and non-monoexponential. The blue and red curves are constructed with ADC⊥ = 0.129 μm2/ms (blue curve, representative of activated optic nerve) and ADC⊥ = 0.176 μm2/ms (red curve, representative of unstimulated optic nerve). This figure is intended to emphasize that the large (27%) stimulus-induced decrease in ADC⊥ results in a modest 6.6% signal increase at b = 1.4 ms/μm2 with visual stimulation.

