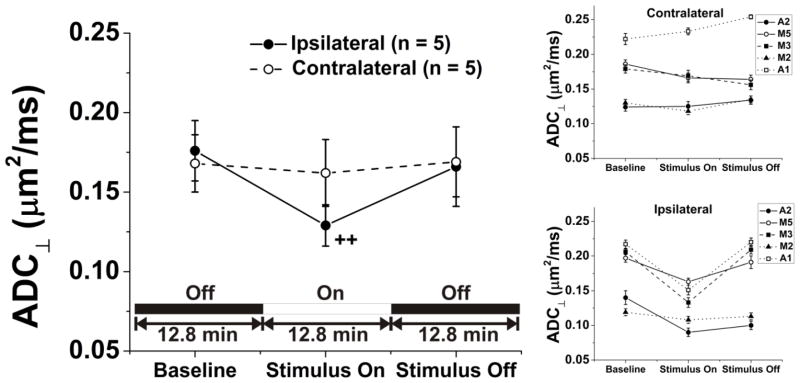
Figure 4.
Application of visual stimulus produces a significant drop in ADC⊥ for the optic nerve of the stimulated eye [Baseline: 0.176 ± 0.019 μm2/ms (mean ± sem), Stimulus On: 0.129 ± 0.013 μm2/ms, ++: p = 0.0008], but no change for the contralateral, unstimulated eye. ADC⊥ in the ipsilateral optic nerves returns to baseline values once again with removal of the stimulus. Quantities shown are the mean ± sem for image voxels within the optic nerve ROI in a group of five experimental mice breathing room air. The insets depict the measurements for the experimental/ipsilateral and control/contralateral optic nerves in individual animals.

