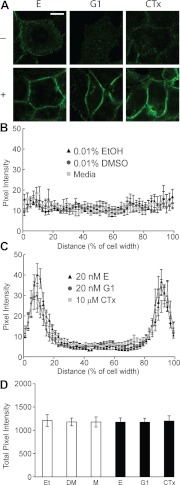
Fig. 6.
Cellular distribution of EMMPRIN with estradiol, G1, and CTx treatment. A, Cells were treated with either 20 nm estradiol (first column), 20 nm G1 (second column), or 10 μm CTx (third column). Rows indicate the presence (+) or absence (−) of treatment; all treatments were performed for 0.1 h. After treatment, cells were fixed, permeabilized, and immunolabeled for EMMPRIN protein and visualized using confocal microscopy. Scale bars, 10 μm. B, Line scans were performed on cells treated with vehicle controls as indicated, and mean pixel intensity ± sd of triplicate analysis and sem was calculated (n = 3). C, Line scans were performed on cells treated with estradiol, G1, or CTx as indicated, and mean pixel intensity ± sd of triplicate analysis and sem was calculated (n = 8 cells for each treatment). D, Total pixel intensity for each scan was determined by Riemann sum integration for vehicle controls (white bars) and treatments (black bars) as indicated. Average total pixel intensity ± sd of triplicate analysis and sem was calculated (n = 8 cells for each treatment).

