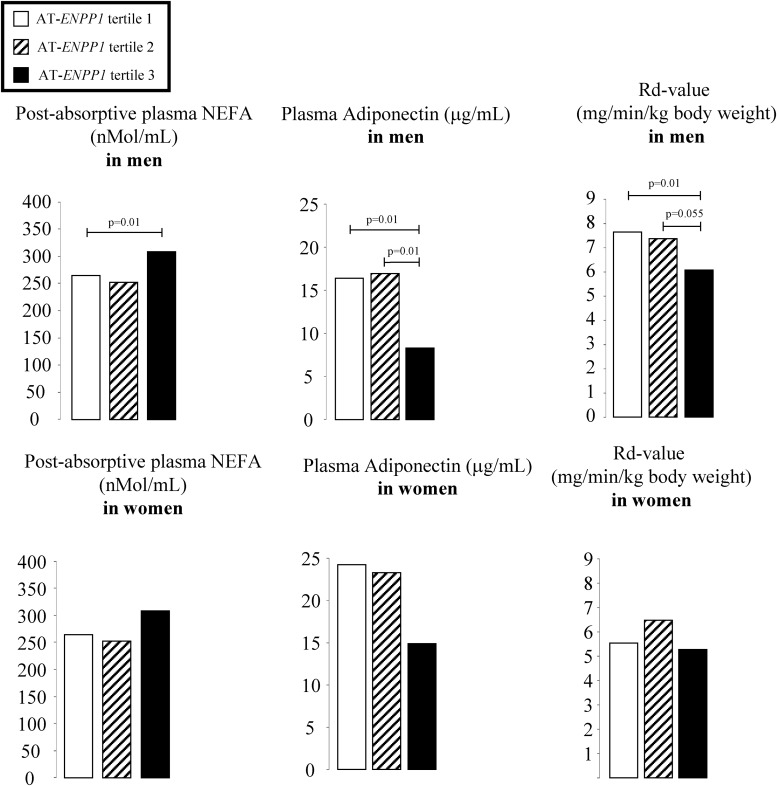
Fig. 2.
The least-squares means of predicted values (after adjusting for total body fat) of plasma NEFA, adiponectin, and Rd values are reported for males and females by tertiles of AT-ENPP1 expression. The values were analyzed after natural log-transformation and then back-transformed to their natural units for presentation. The groups identify tertiles of AT-ENPP1 gene expression, and P values are based on one-way ANOVA of the natural logarithms of variables with Tukey-Kramer adjustment for multiple comparisons. The model included body fat content and ENPP1 gene expression.

