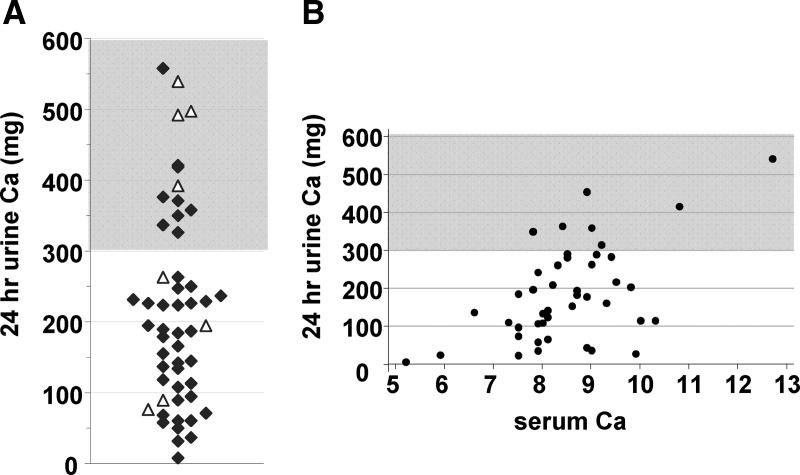
Fig. 3.
Urine calcium parameters. A, Distribution plot of the most recently recorded 24-h urine calcium value (n = 53); ▵, patients prescribed a thiazide medication. B, Scatterplot of all 24-h urine calcium levels with serum calcium levels recorded the same day (n = 44, representing 22 patients). Unshaded areas represent target range (<300 mg).

