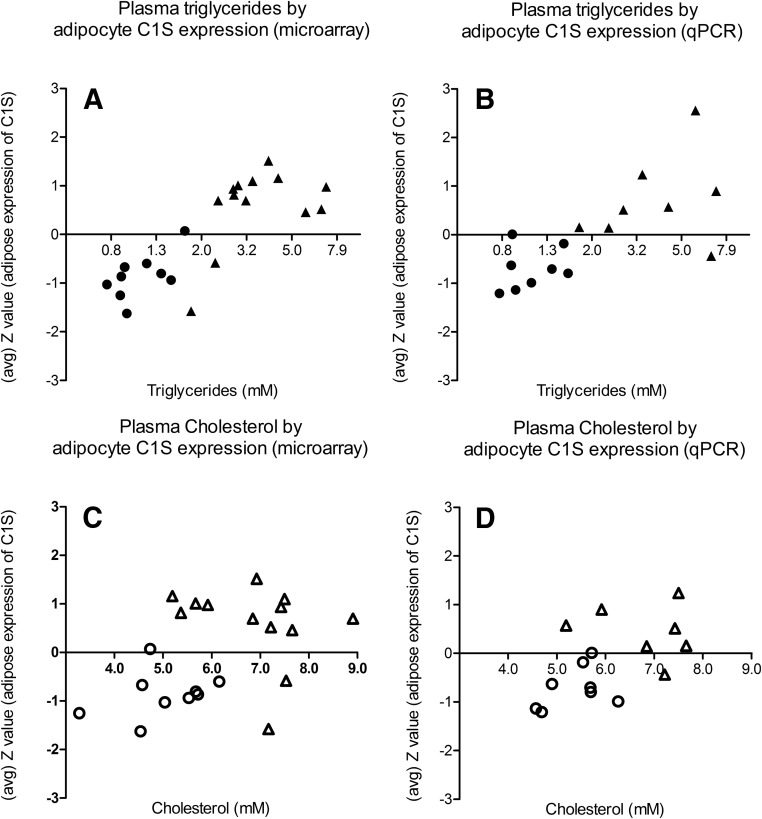
Fig. 2.
Complement C1S expression in the sc adipocyte fraction is associated with plasma triglyceride levels, rather than with plasma cholesterol levels. Circles represent the control subjects, and triangles are the hyperlipidemic subjects. Upper panels, The regression coefficients r were 0.807 (P < 0.001) and 0.720 (P = 0.002) for the correlations of plasma triglycerides (log transformed) with C1s on microarray (A) and qPCR (B) data, respectively. Lower panels, The regression coefficients r were 0.437 (P = 0.042) and 0.561 (P = 0.030) for the correlations of plasma cholesterol with C1S on microarray (C) and qPCR (D) data, respectively.

