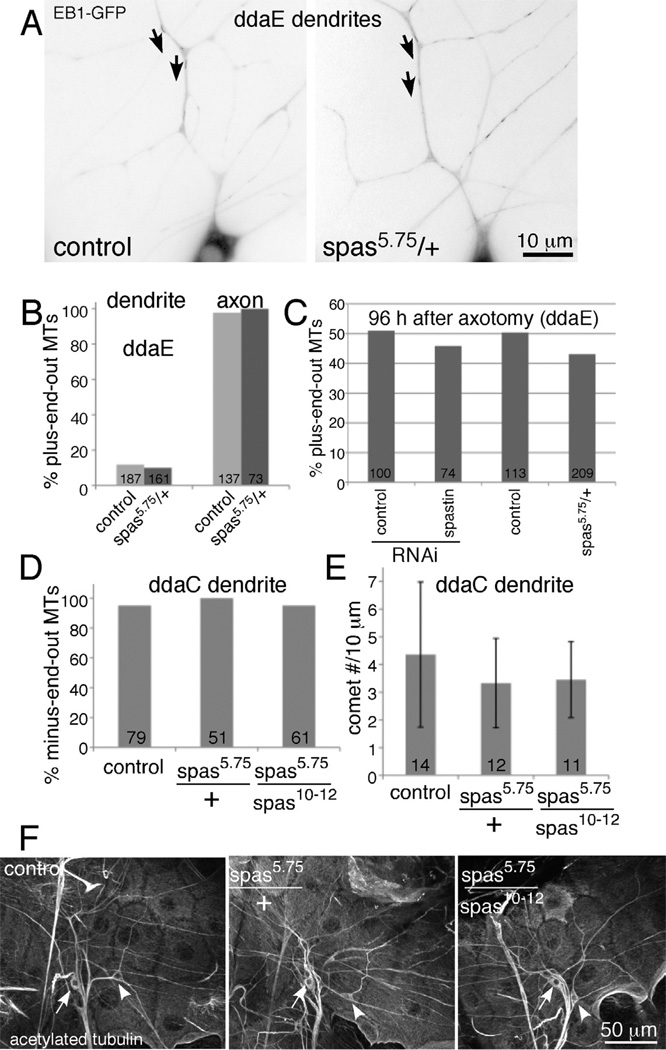
Figure 3. Microtubule polarity and dynamics are not detectably altered in uninjured spastin mutant neurons.
A and B. Microtubule polarity in ddaE was quantitated in movies of EB1-GFP comets in control animals (221-Gal4, UAS-EB1-GFP in yw background) and spastin heterozygotes. Example images from each genotype are shown. Each image is a maximum z projection of 6 frames from the movies presented in Movie 1. Dendrite microtubule polarity was quantitated based on direction of comet movement in the main trunk of ddaE (arrows are placed beside examples of comets moving towards the cell body in the main trunk and point in the direction of movement). Axonal polarity was quantitated in the proximal axon based on similar movies. Numbers on the graph indicate numbers of comets counted in each condition. C. EB1-GFP was expressed in ddaE with 221-Gal4. Timelapse movies of EB1-GFP comet movement were used to determine the number of plus and minus-end-out microtubules in dendrites and axons. Proximal axotomy of ddaE was performed as in Figure 1. At the 96 h timepoint, the total number of plus and minus-end-out microtubules in all dendrites was counted. Spastin heterozygotes added similar numbers of plus-end-out microtubules as control animals to dendrites. n’s indicate total number of microtubules scored in all the animals tested. The same animals in which tip growth was measured for previous figures were used. D and E. EB1-GFP was expressed in class IV neurons including ddaC with the 477-Gal4 driver in control, spastin heterozygous animals or animals with two mutant copies of the spastin gene. At least 10 animals from each genotype were analyzed. For D, EB1-GFP comets were scored as moving towards or away from the cell body in movies of ddaC neurons. Numbers on the bars are the total number of comets analyzed. For E, the number of EB1-GFP comets in a 10 micron stretch of a ddaC dendrite was counted in a 200 frame timeseries. The average number of comets is shown in the graph and the error bars show the standard deviation. Numbers on the bars indicate the number of cells analyzed. F. Animals of the same genotypes used in D and E were dissected and stained for aceylated tubulin. Representative images for each genotype are shown.

