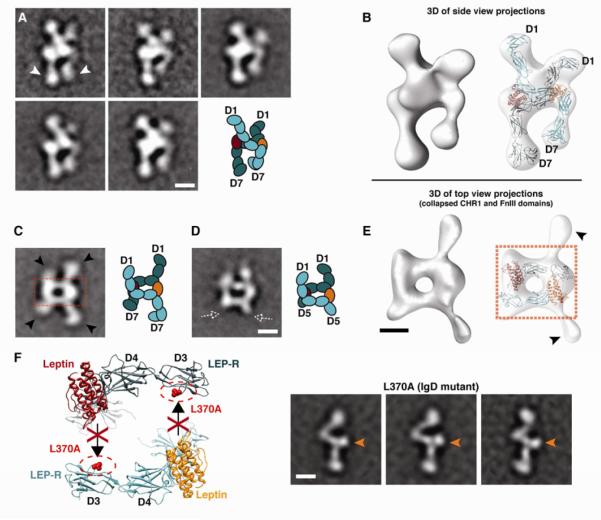
Figure 3. Architecture of the quaternary leptin/LEP-R signaling complex.
A) 2D class averages of side-view projections reveal the cross-over configuration of two LEP-R extracellular chains. The two chains connect at the CHR2 level, while the membrane-proximal domains (white arrowheads) point towards each other and arrive in close proximity at their C-terminal tips. B) 3D reconstruction of the leptin/LEP-R side-view projections shown in (A). Flexible docking of two liganded LEP-R chains into the 3D density map shows the complex configuration (right). C) Representative 2D class average of a top view of the quaternary leptin/LEP-R[D1-D7] complex. In this type of projections the N-terminal CHR1 and C-terminal FnIII domains are collapsed on the carbon support (black arrowheads). The boxed area shows the rectangular formation that is reminiscent of the anti-parallel gp130/IL-6 or GCSF/GCSF-R interaction. D) Representative 2D class average of a top view of the quaternary leptin/LEP-R[D1-D5] complex, as in (C). The dashed white arrowheads point to missing densities from the omitted C-terminal domains of the truncated construct, as compared to (C). E) 3D reconstruction from top-view leptin/LEP-R[D1-D7] projections shown in (C), and docked gp130/IL-6 crystal structure into the central rectangular density of the 3D map (right). F) Mutation L370A on the IgD (D3) of LEP-R abolishes leptin binding via epitope III. EM class averages of this mutant after incubation with leptin reveal only monomeric receptor chains with ligand bound at CHR2 (orange arrows). All scale bars correspond to 5 nm.

