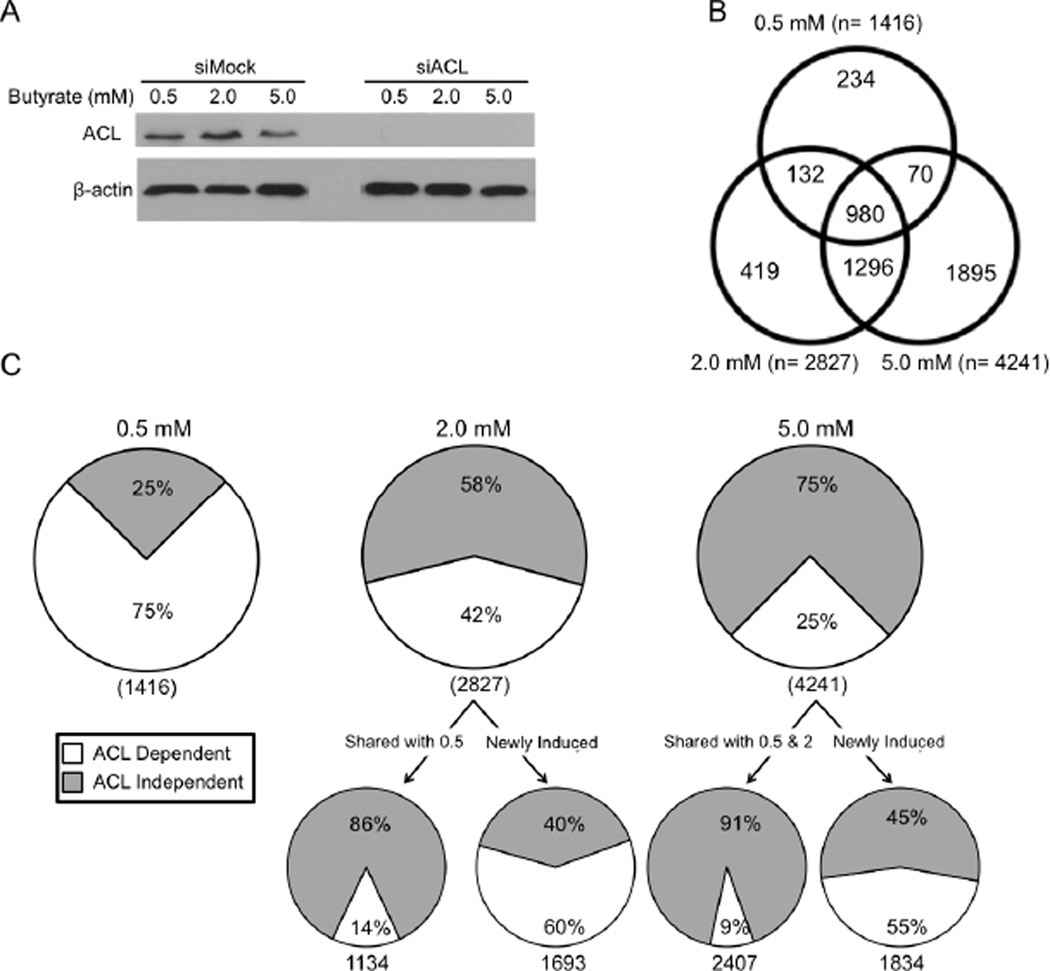
Figure 6. Butyrate Regulates Gene Expression Using ACL-Dependent and -Independent Mechanisms.
(A) Western blot analyses of HCT116 cells used for transcriptome profiling. ACL (top panel) and β-actin loading control (bottom panel) levels are shown in siMock and siACL cells in response to different butyrate treatments.
(B) Venn diagram showing the overlap between genes upregulated by butyrate at doses of 0.5, 2, and 5 mM.
(C) Pie charts showing the percentage of genes upregulated by 0.5-mM (left), 2-mM (middle), and 5-mM (right) butyrate in an ACL-dependent (white) and -independent (gray) manner. Beneath the 2 mM and 5 mM pie charts are two additional pie charts. The chart shown on the left corresponds to genes that were also upregulated at the previous dose (shared). The chart shown on the right corresponds to genes that were not upregulated at the previous dose (newly induced).

