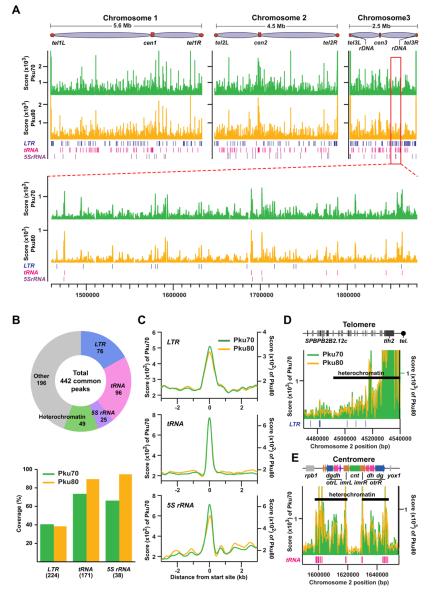
Figure 1. Genome-wide distribution of Ku binding.
(A) Chromosomal distributions of Pku70 (green) and Pku80 (yellow) were determined based on ChIP-seq analyses. ChIP was performed using strains carrying Pku70-Myc and Pku80-Myc proteins.
(B) Summary of PKu distributions across the fission yeast genome. Pie-chart shows the composition of Pku70/Pku80 common peaks (top). Coverages of LTR, tRNA, and 5S rRNA genes estimated by the presence of significant Pku binding peaks within 300 bp from the genes are shown in the bar graph (bottom). Each number in parenthesis indicates the total gene number.
(C) Average binding patterns of Pku proteins at LTR, tRNA, and 5S rRNA genes.
(D and E) Pku distributions at the right telomere (D) and centromere (E) of chromosome 2.

