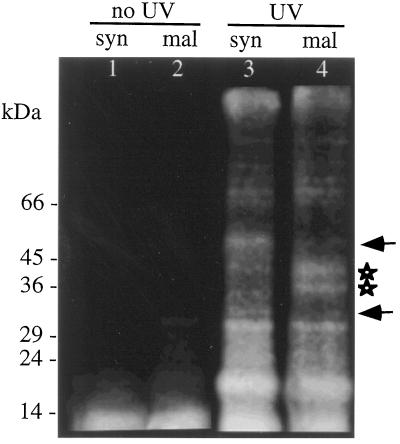
Figure 5.
Fluorograph of proteins labeled in vivo by photoaffinity syntide-2 or photoaffinity malantide. Protoplasts were electroporated with fluorescent, photoaffinity-labeled syntide-2 or malantide and allowed to recover for 1 h. The protoplasts were then frozen in liquid N2 to freeze molecular interactions, and total proteins were extracted in the dark (lanes 1 and 2). In parallel experiments the peptide-loaded protoplasts were UV irradiated to cross-link the photoaffinity peptides to closely associated proteins and then extracted (lanes 3 and 4). Proteins were then separated by SDS-PAGE. Peptide-labeled proteins were visualized using the fluorescein attached to the photoaffinity peptides. Note the 30- and 55-kD proteins selectively labeled by syntide-2 (arrows) and the 33- and 41-kD specific to malantide (stars). The positions of molecular mass markers are indicated in kilodaltons on the left.

