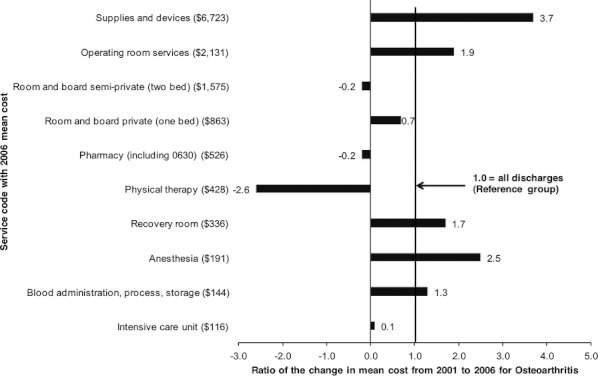
Figure 3.

Ratio of the Change in Mean Cost for the Top 10 Service Codes with Statistically Significant Change between 2001 and 2006, Osteoarthritis versus All Discharges*Note. *2001 costs have been inflation adjusted to 2006 dollars.

Ratio of the Change in Mean Cost for the Top 10 Service Codes with Statistically Significant Change between 2001 and 2006, Osteoarthritis versus All Discharges*Note. *2001 costs have been inflation adjusted to 2006 dollars.