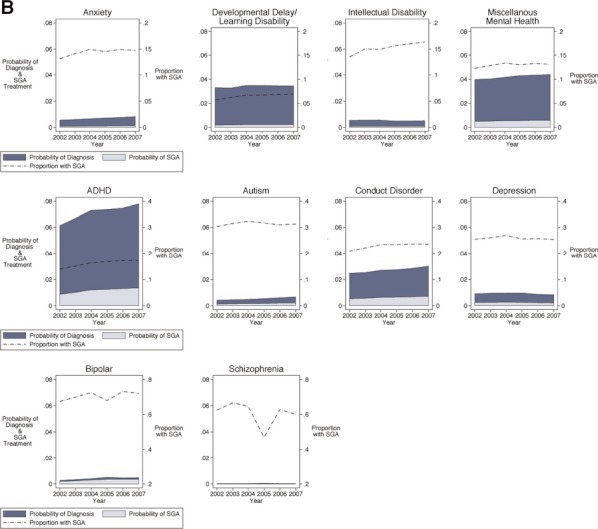
Figure 3.

Adjusted Trends in Mental Health Diagnosis and SGA Treatment among U.S. Medicaid-Enrolled Children: Six- to Eleven-Year Olds Note. Plots are ordered in rows by proportion of SGA use by diagnosis, with the top row having the lower proportions (y scale, right axis, 0–0.2) and the bottom row having the higher proportions (y scale, right axis, 0–0.8). Each graph plots three values from 2002 to 2007 (x axis). For example, for the 6- to 11-year olds with a diagnosis of ADHD (middle row), the probability of diagnosis increased from 0.06 to 0.08 over these 6 years (y axis, left scale), the probability of treatment increased from 0.010 to 0.014 (y axis, left scale), and the proportion of SGA use among those with a diagnosis of ADHD increased from 0.14 to 0.17 (y axis, right scale).
