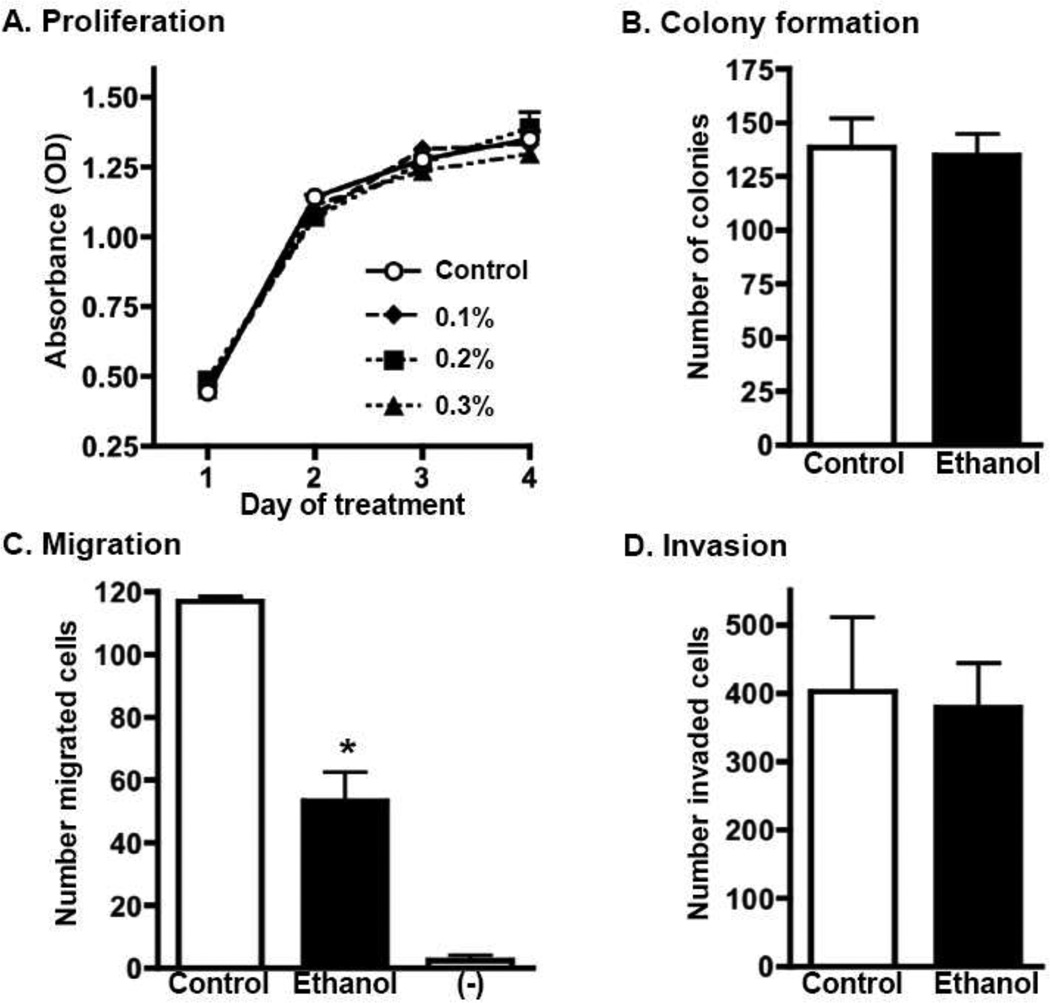
Fig. 4.
Effect of ethanol on in vitro assays measuring proliferation, colony formation, migration, and invasion. (A) 4T1.2 cells were treated daily with media containing indicated concentrations of ethanol. Cell proliferation was evaluated using a WST-1 assay on days 1–4 of treatment. Error bars indicate SEM of triplicate cultures. (B) 4T1.2 cells were pre-treated with 0.3% w/v ethanol for 48 hours, then cultured in semi-solid agar containing 0.3% w/v ethanol. Control cultures were not exposed to ethanol. Bar graphs show the average number of colonies that formed after 3 weeks of culture (± SEM, of triplicate cultures). (C&D) 4T1.2 cells were pre-treated with 0.3% w/v ethanol for 24 hours, then added to the top chamber of a transwell system. FBS-containing media was placed in the lower chamber as a chemoattractant. 0.3% w/v ethanol was also present in the media of both transwell chambers. Control cultures were not exposed to ethanol. “-“ indicates the amount of background cell migration in transwells containing no FBS as a chemoattractant. Bar graphs show the average number of cells (± SEM, from triplicate wells) that migrated across the semi-permeable membrane (C), or invaded through a Matrigel-coated membrane (D)

