
Figure 1.
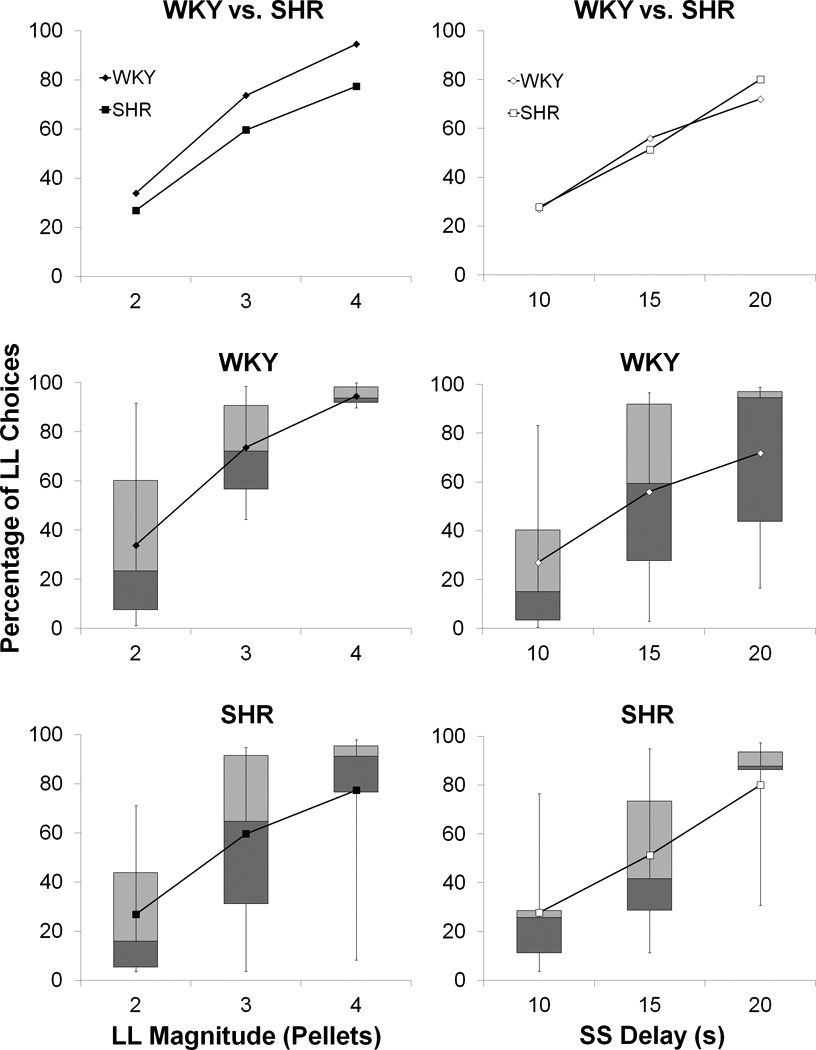
The percentage of choices made to the LL lever for the WKY and SHR strains. The left column shows the data for the LL magnitude manipulation, while right column shows the data in the SS delay manipulation. The top row displays the group means and the middle and bottom rows show the box plots for each individual strain. The different phases in the LL reward magnitude manipulation are labeled according to the number of pellets received on the LL lever in each phase. In the SS delay manipulation, the different phases are labeled according to the delay to the receipt of the SS reward in each phase. The LL delay was always 30 s and the SS reward was always 1 pellet.