
Figure 6.
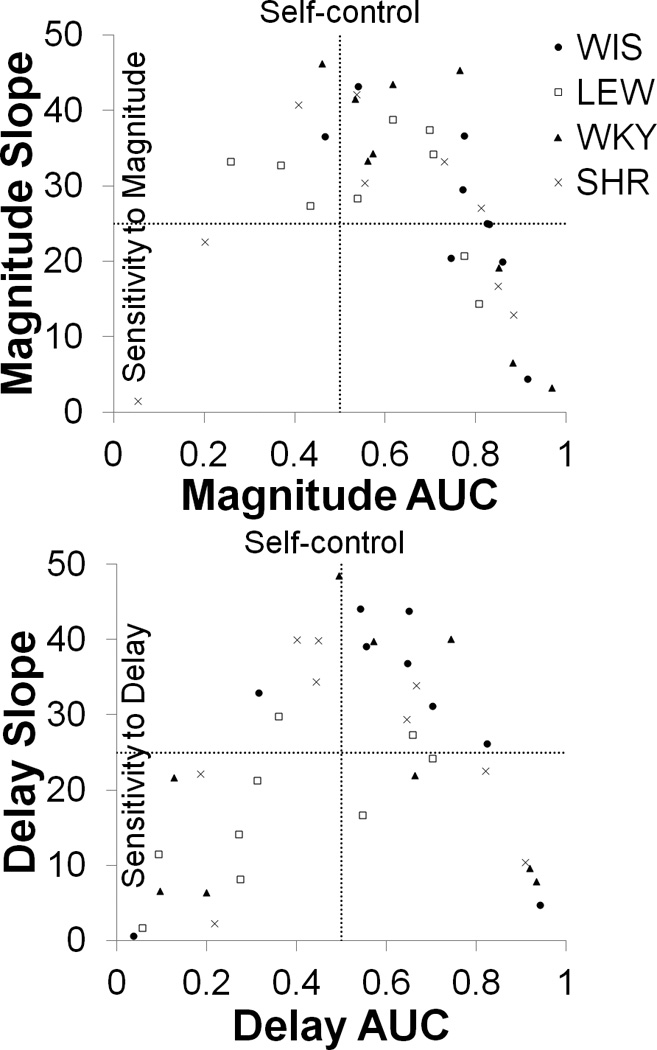
Scatter plot of the AUC vs. slope for the LL magnitude (top panel) and SS delay (bottom panel) tasks comparing all four strains. The horizontal axis shows different levels of self-control; AUC values greater than 0.5 indicate more self-controlled choices (preference of LL). The vertical axis displays different levels of sensitivity to the magnitude or delay changes; higher values indicate greater sensitivity to change. Each quartile represents different patterns of performance where the upper right quartile would contain the ideal performance, which indicates generalized self-control bias coupled with good sensitivity to change, and the lower left quartile is the least ideal pattern, which indicates generalized impulsive bias coupled with poor sensitivity.