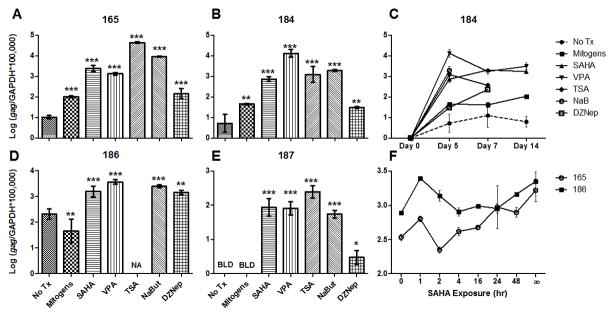
Figure 3. SAHA, VPA, TSA, NaB, and DZNep reactivate transcription from the latent FIV promoter.
CD4+ T-cells from 4 asymptomatically FIV-infected cats were cultured ex vivo in the presence of 1μM SAHA, 3mM VPA, 250nM TSA, 5mM NaB, no treatment (No Tx), or mitogens. RNA was harvested from cells on days 0, 5, 7, and 14 post-culture, and levels of FIV gag cDNA were normalized to cellular GAPDH cDNA. Day 5 values are displayed for cats 165 (A), 184 (B) 186 (D), and 187 (E); the full 14-day time course is displayed for cat 184 (C). Values were not available (NA) for TSA, NaB, and DZNep on day 14 in (C), and TSA on day 5 in (D), due to an insufficient quantity of RNA recovered from the sample. FIV gag transcripts for no treatment and mitogen-treated cells in (E) were below the limit of detection (BLD), despite sufficient quantities of RNA. Error bars represent the standard deviation of triplicate qPCR measurements, and one-way ANOVA followed by Dunnett’s multiple comparison post-test (GraphPad Prism) was used to determine significant differences relative to the no treatment control (*p < 0.05, **p < 0.01, ***p < 0.001). In a separate experiment shown in (F), CD4+ T-cells from cats 165 and 186 were exposed to SAHA for varying amounts of time (∞ = continuous exposure), washed, and cultured for a total of 5 days. RNA was analyzed as above, and error bars represent the standard deviation of triplicate qPCR measurements. One-way ANOVA followed by post-test for linear trend revealed a positive correlation between SAHA exposure time and FIV transcriptional reactivation (165: p < 0.0001; 186: p = 0.0056).

