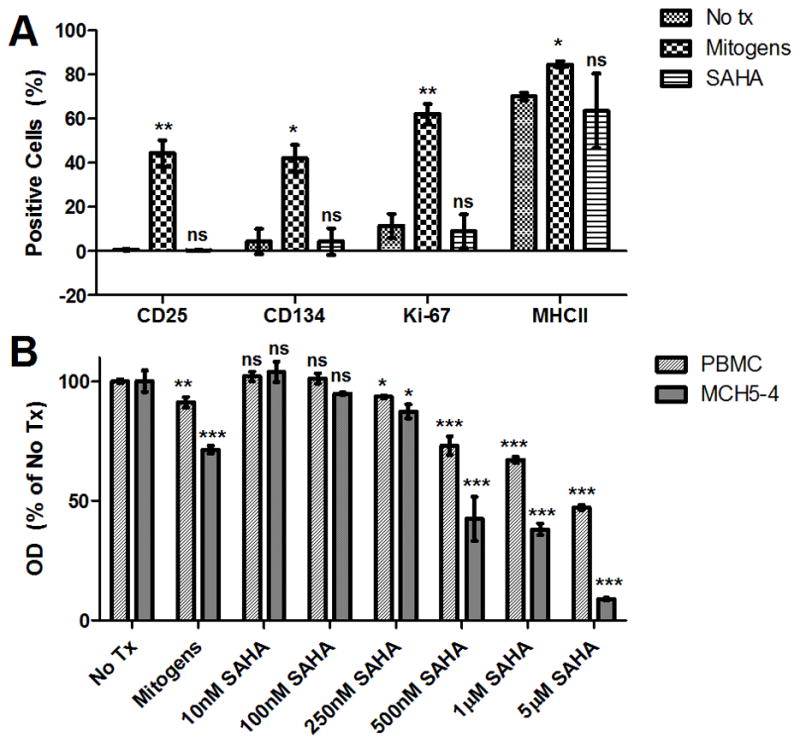
Figure 6. SAHA is not immune-activating or toxic in feline PBMC.

PBMC from cats 165 and 186 were cultured in the presence of 1μM SAHA, no treatment (No tx), or mitogens for 3 days, harvested, and labeled separately for CD25 (clone 9F23; gift of Koichi Ohno, University of Tokyo), MHC Class II (clone 42.3, gift of Peter Moore, UC Davis), Ki-67 (Mib-1 clone, Dako), or CD134 (AbD Serotec). Percent expression of the activation markers was determined by flow cytometry (FC500 Flow Cytometer, Beckman Coulter; FlowJo software v7.6.5, Treestar) after a broad forward- and side-scatter sizing gate (A). Mean and standard deviation expression frequencies (%) in cells from the 2 cats are displayed, and unpaired, two-tailed t-tests (GraphPad Prism) were used to determine significant differences in expression compared to no treatment controls (ns – not significant, *p < 0.05, **p < 0.01 compared to the corresponding no treatment control). SPF feline PBMC and MCH5-4 (feline T-cell lymphoma line) were incubated for 48 hours in the presence of varying concentrations of SAHA (10nM to 5μM), no treatment (No Tx), or mitogens, and a commercial MTT assay (ATCC) was performed to determine cell viability (B). Optical densities (OD) were normalized to no treatment controls after media-only background subtraction. Error bars represent the standard deviation of triplicate MTT assays, and one-way ANOVA followed by Tukey’s multiple comparison post-test (GraphPad Prism) was used to determine if there was a significant difference among treatments (ns - not significant, *p < 0.05, **p < 0.01, ***p < 0.001 compared to the corresponding no treatment control).
