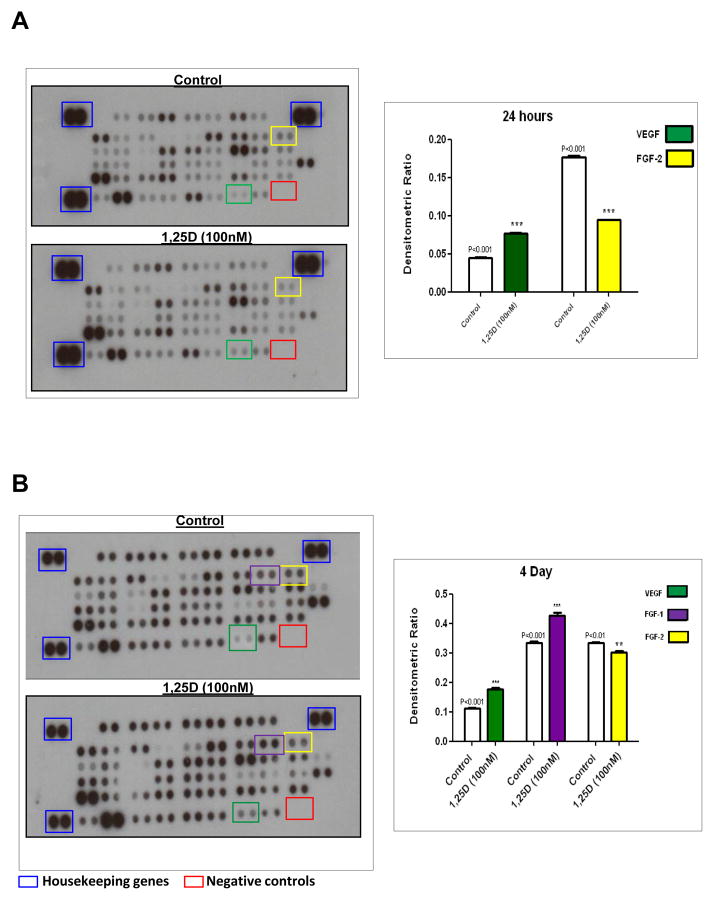
Figure 1. Angiogenesis expression is regulated by 1,25-D3 treatment.
Protein extracts were incubated with a cocktail of biotinylated detection antibodies and then incubated in a membrane array containing 53 different anti-angiogenesis antibodies, in duplicates, followed by streptavin peroxidase and chemioluminescence. The densitometric signal produced by each spot run in duplicate was proportional to the amount of angiogenesis factors bound as determined by densitometry analysis. Panel A, left: Representative membranes for Control and 1,25-D3 treatment for 24hs, right: densitometric analysis. Panel B, left: Representative membranes for Control and 1,25-D3 treatment for 4 days, right: Densitometry analysis. Housekeeping genes (blue squares) and negative controls (red squares) are included in each membrane array to compensate for background and intensities differences. **p<0.01; ***p<0.001 with respect to control #p<0.05

