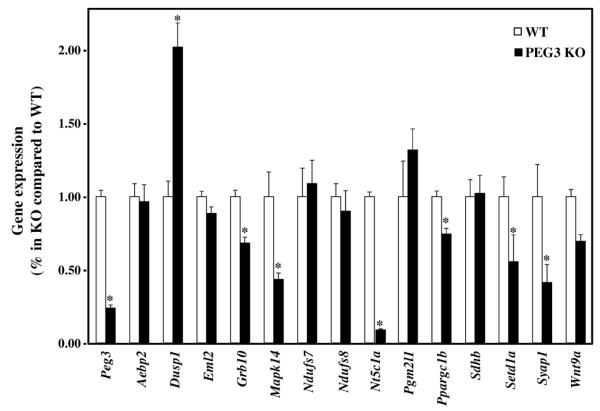
Figure 5. qRT-PCR RNA expression analysis of PEG3 bound genes.
The expression levels of PEG3 bound genes were compared between two sets of total RNA isolated from mouse neonatal brains that were either wild-type (WT) or have reduced expression of Peg3 (KO). Individual gene expression was first normalized to β-actin levels, and then normalized against the WT levels. All data are graphed as the percentage of expression in the KO mice as compared to expression in the WT mice. Bars with asterisks represent values that were statistically different by a p-value less than 0.05.

