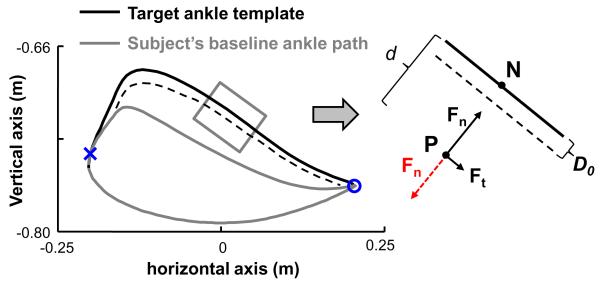
Figure 2.
Example ankle path template with origin set at the hip joint. The blue circle indicates the timing of heel strike and the blue cross indicates the timing of toe-off. The target ankle template was created individually for subjects based on their baseline ankle path and step height. The distance ‘d’ is defined from the current ankle position (P) to the nearest point on the prescribed ankle path (N). D0 is defined as the width of virtual wall (in millimeters). The normal forces (Fn) were produced only when the distance between P and N exceeded D0. The tangential forces (Ft) were minimal, designed to ensure that the subjects’ leg produced continuous movement along the ankle path. When subjects’ instantaneous ankle position (P) fell below the virtual wall (the black dashed line) of the nearest point on the target template (N), the performance-based error-augmentation algorithm led to generation of a spring-like force of positive stiffness by the motors, tending to take the subject’s leg further away from the target (N) (see the Fn, dashed red line). In contrast, the error-reduction algorithm led to a spring-like force being generated with negative stiffness, tending to bring subject’s foot towards the target (N) (see the Fn in black line). The amplitude of the normal force (Fn) was proportional to the deviation between subjects’ instantaneous ankle position and the prescribed ankle position.

