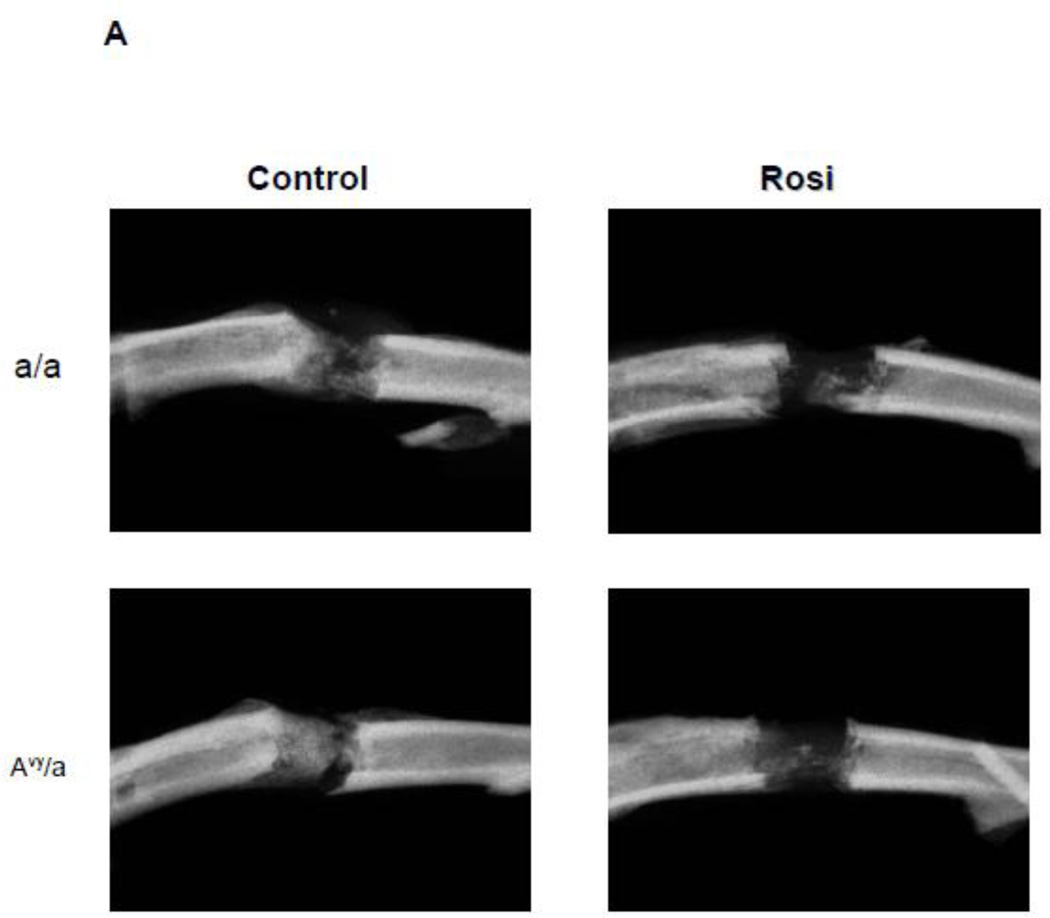
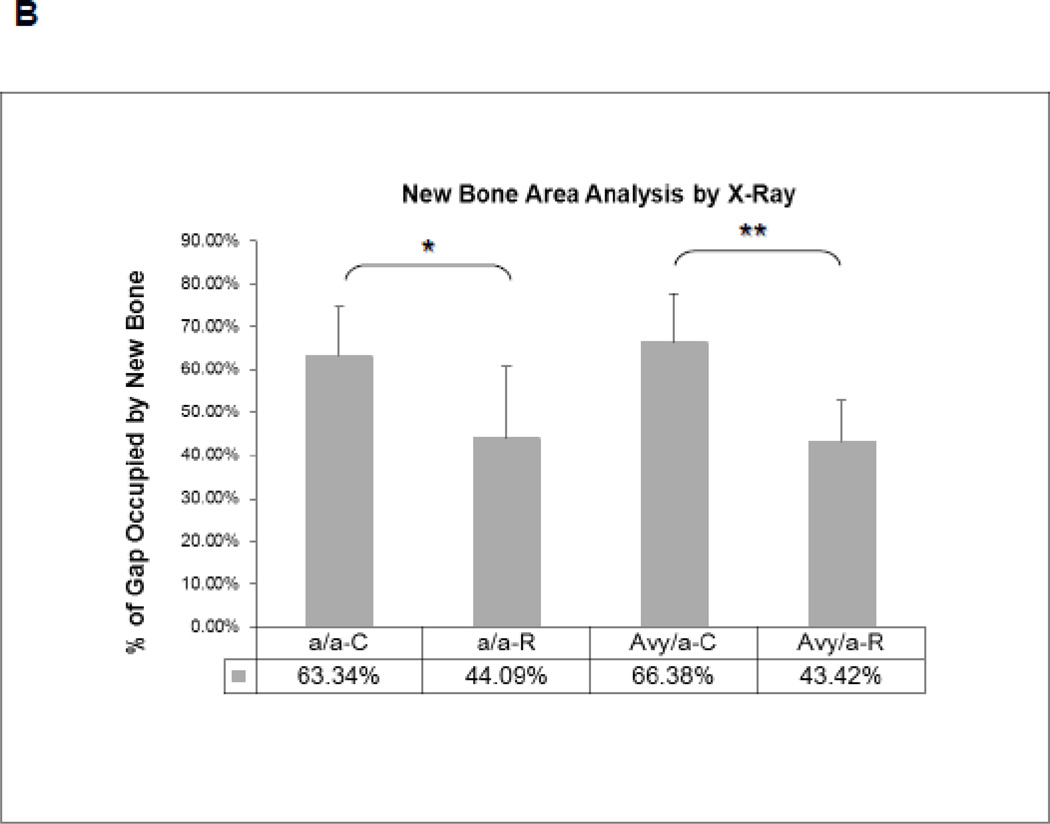
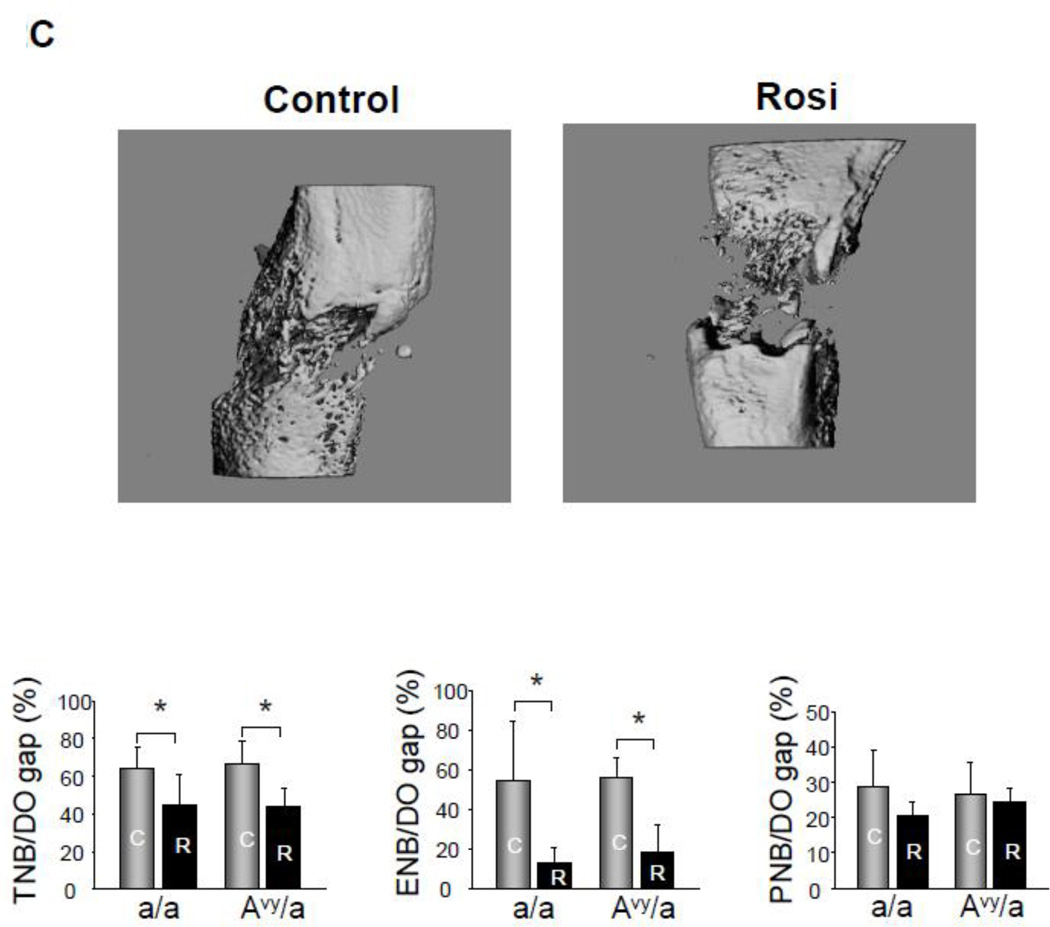
Figure 2.
Radiographic comparison of the distraction gaps in the four test groups (a/a, Avy/a, Untreated “C”, Rosi treated “R”). A. Representative images from each group, Proximal is left to distal right. Magnif 1x. B. Percent of gap area occupied by new bone (average TNB - total new bone formation) in each of the 4 groups. C. Percent of gap area occupied by endosteal new bone formation (ENB) as measured by microCT compared to total new bone (TNB) and periosteal new bone (PNB). Note that the percentages for TNB compare favorably to plain radiographic analysis in B. Gray bars – control “C”, black bars – rosiglitazone “R”. * p < 0.05; ** p < 0.01.


