Figure 3.
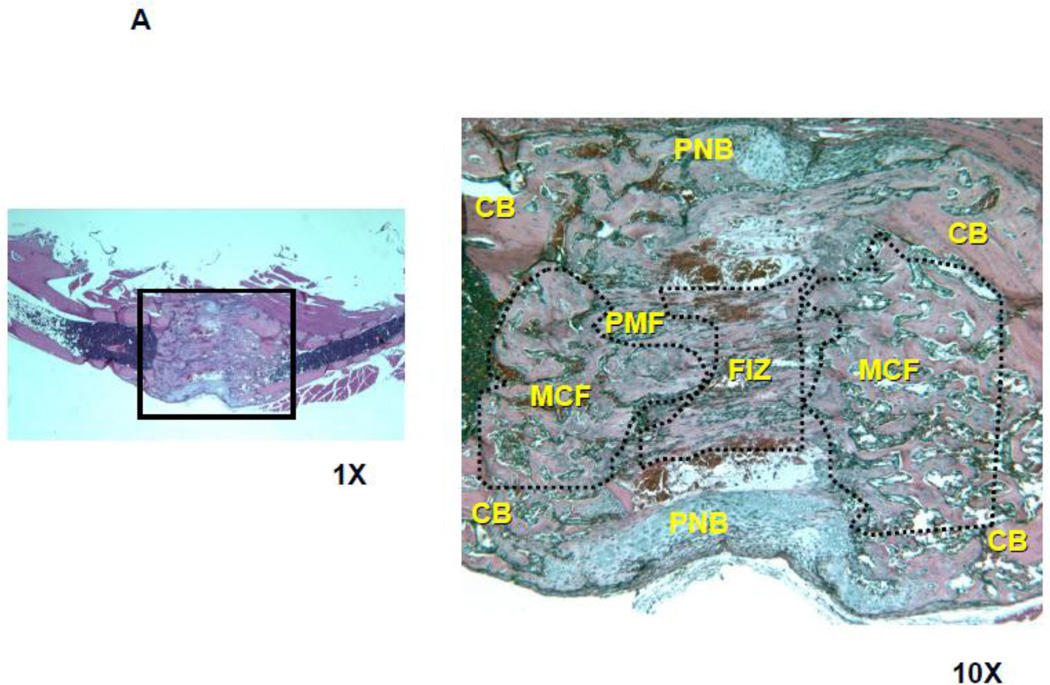
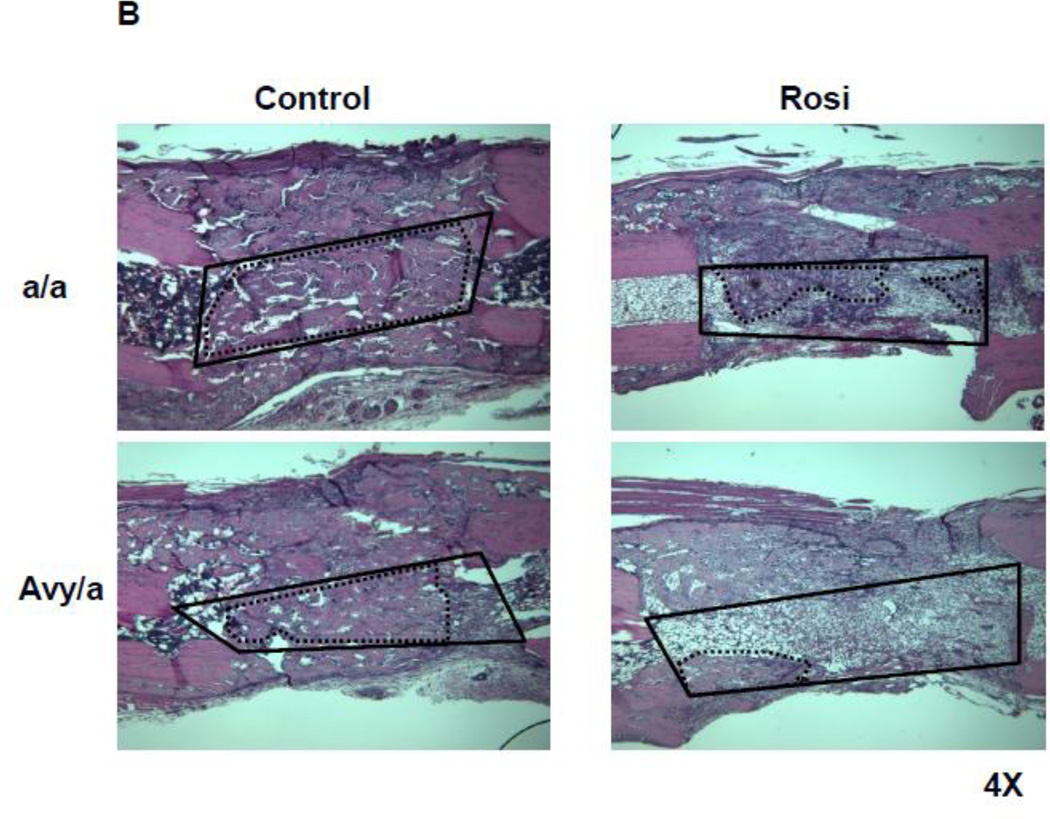
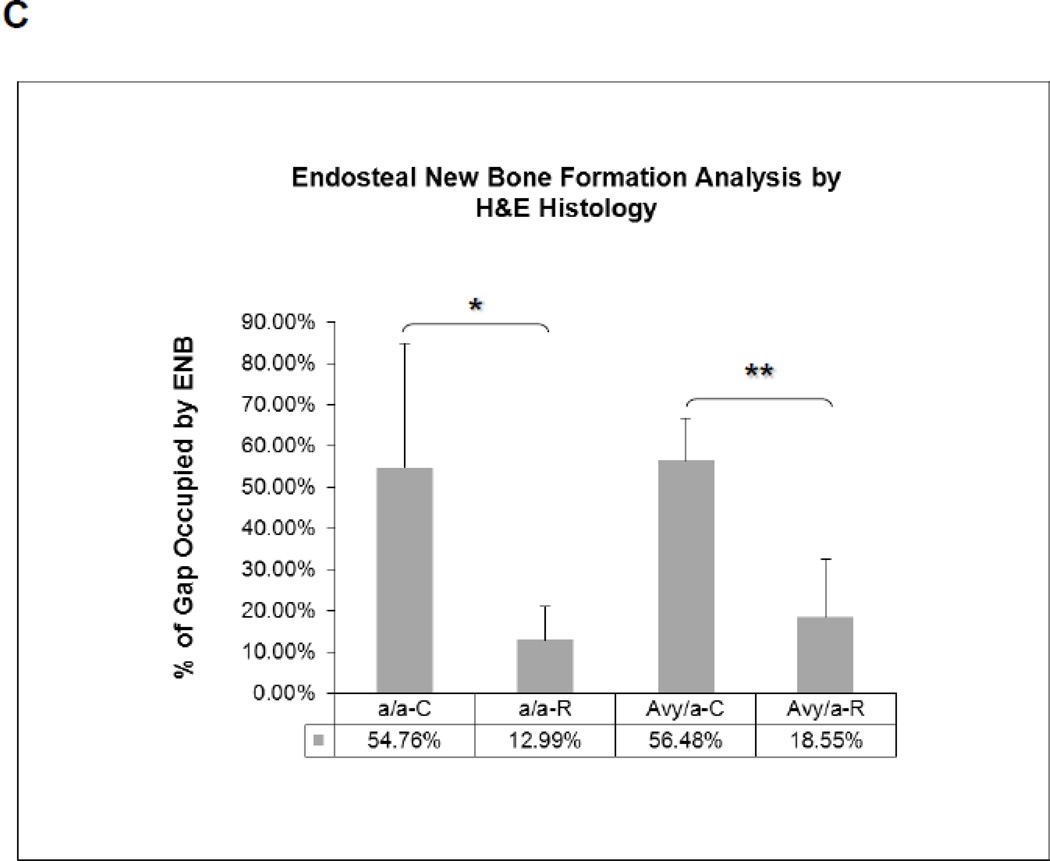
Histologic comparison of the distraction gaps in the four test groups (a/a, Avy/a, Untreated “C”, Rosi treated “R”). A. Typical specimen H&E stain at 1x and then 10x to demonstrate the zones of bone formation. The FIZ is a radiolucent fibrous interzone [14–17]. At the junctions of the proximal and distal FIZ, concentrated zones of cell proliferation occur at the tip of each new bone trabeculum, termed the primary matrix front (PMF)[14–17]. Following proliferation, these cells migrate to local type 1 collagen produced by fibroblasts in the FIZ and begin to lay down osteoid matrix. New cells are added to each trabeculum incorporating the surface osteoblasts into the matrix, expanding to uniform diameters of 100–150 microns, termed the zone of microcolumn formation (MCF)[14–17]. These are labeled and outlined on the histological specimen: FIZ, PMF and MCF proximal and distal within the box square region of interest. B. Representative images from each group, Proximal is left to distal right. The ENB (dotted) within the endosteal distraction gap (solid) is outlined . Magnif. 4×. Hematoxylin-eosin stain of decalcified mid-sagittal sections. Note that proximal and distal host bone cortices separate ENB from PNB. C. Comparison by % of gap occupied by ENB in the 4 groups, (a/a, Avy/a, Untreated “C”, Rosi treated “R”). Note that the percentages compare favorably to the ENB measured by microCT in Figure 4C. * p < 0.05; ** p < 0.01.


