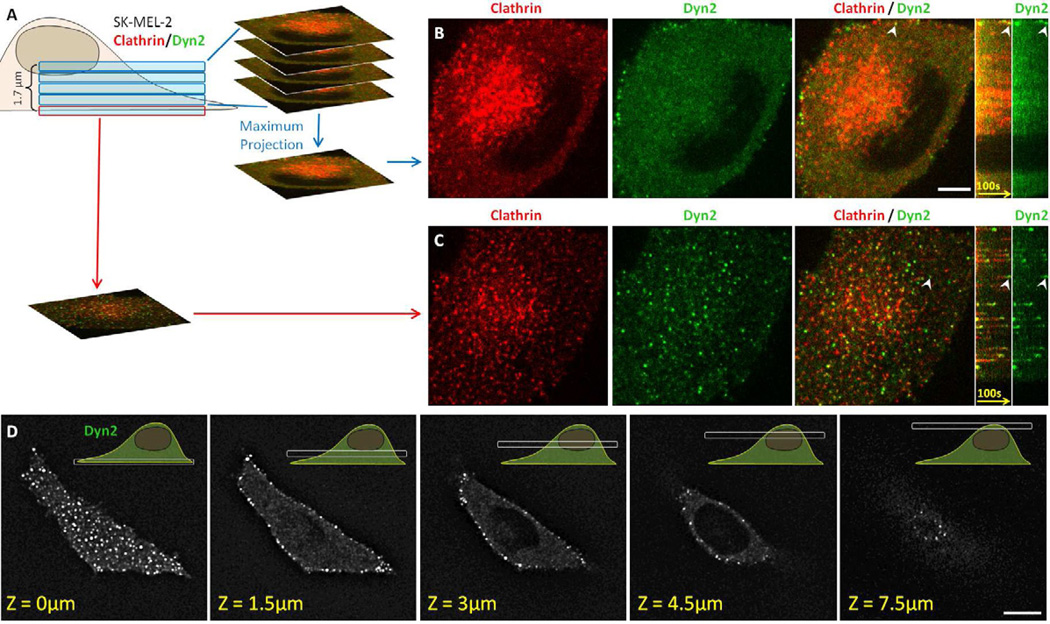
Figure 4. 3D live cell imaging of genome-edited cells expressing fluorescently tagged clathrin and dynamin2.
(A) Visualization strategy used to acquire the 3D time series shown in B and C using SK-MEL-2 cells stably expressing clathrin light chain A and dynamin2 (hCLTAEN/DNM2EN). Each Z-stack consisted of 5 sequential optical sections spaced by 350 nm obtained every 2 seconds using 30 ms exposures.
(B) Snapshot from a maximum intensity projection and corresponding kymograph obtained from the top 4 optical sections corresponding to the intracellular region containing the TGN and endosomes (highlighted by the concentrated clathrin signal) showed absence of fluorescence bursts of dynamin2-EGFP. The bright dynamin2-EGFP at the cell periphery associated with endocytic clathrin LCa-RFP-containing carrier, an example of which is highlighted by the arrowhead. Scale bar, 10 µm.
(C) Snapshot from the bottom optical section containing the plasma membrane and corresponding kymograph acquired from the same cell imaged in B. It showed numerous fluorescence bursts of dynamin2-EGFP associated with clathrin LCa-RFP prior to clathrin coat disassembly; the arrowhead highlights a representative example.
(D) Selected optical sections obtained from a 3D live cell imaging series obtained from a SKMEL-2 cell stably expressing dynamin2-EGFP (DNM2EN). The Z-stack consisted of 25 optical sections separated by 350 nm and imaged with 100 ms exposures. Bright dynamin2-EGFP were only observed at the cell periphery. Scale bar, 10 µm.

