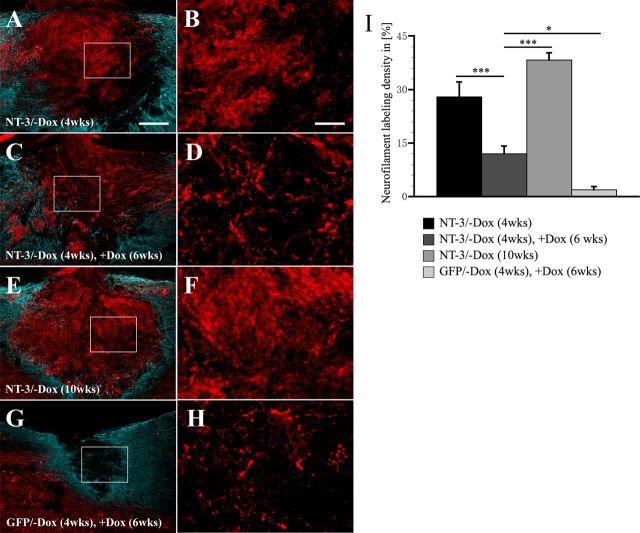
Figure 10.
Quantification of NF-labeling density in the graft/lesion site after transient NT-3 expression. Axons (red) within the grafts are surrounded by astrocytes identified by GFAP-labeling (blue). A, B, Grafts are densely penetrated by NF-labeled axons if NT-3 gene expression is turned on for 4 weeks (NT-3/−Dox, 4 weeks). C, D, Axon density declines when NT-3 gene expression is turned on (−Dox) for 4 weeks and subsequently turned off (+Dox) for 6 weeks (NT-3/−Dox, 4 weeks, +Dox, 6 weeks). E, F, Only if NT-3 expression is continuously turned on for 10 weeks (NT-3/−Dox, 10 weeks), NF-labeled axons are sustained within the lesion site. G, H, Very few axons extend into the lesion site of animals injected with tet-off-GFP virus when gene expression is turned on for 4 weeks and subsequently turned off for 6 weeks (GFP/−Dox, 4 weeks, +Dox, 6 weeks). B, D, F, H, Shows higher magnifications of areas boxed in A, C, E, and G, respectively. I, Quantification of NF-labeling density indicates a significant reduction in axon density when NT-3 gene expression is turned off. Scale bars: (in A) A, C, E, G, 200 μm; (in B) B, D, F, H, 50 μm. *p < 0.05, **p < 0.01, ***p < 0.001; ANOVA followed by Fisher's post hoc test.

